Logs
Each part of a Sandbox keeps its own log.
| Log | What it contains |
|---|---|
| Setup | First boot commands and fetch steps, with exit codes |
| App | Output of a long-running application |
| Command | Output of a single executed command |
| HTTP requests | Requests arriving on an endpoint |
| Activity | Who did what to the Sandbox |
Setup log
Everything that happened while the Sandbox was being provisioned: stdout and stderr of the first boot commands, and of each fetch source including its build command, with exit codes.
In the Logs tab, pick the Boot entry - labeled First Boot CMDs - from the dropdown. Search and refresh help you find a specific line.
Image loading...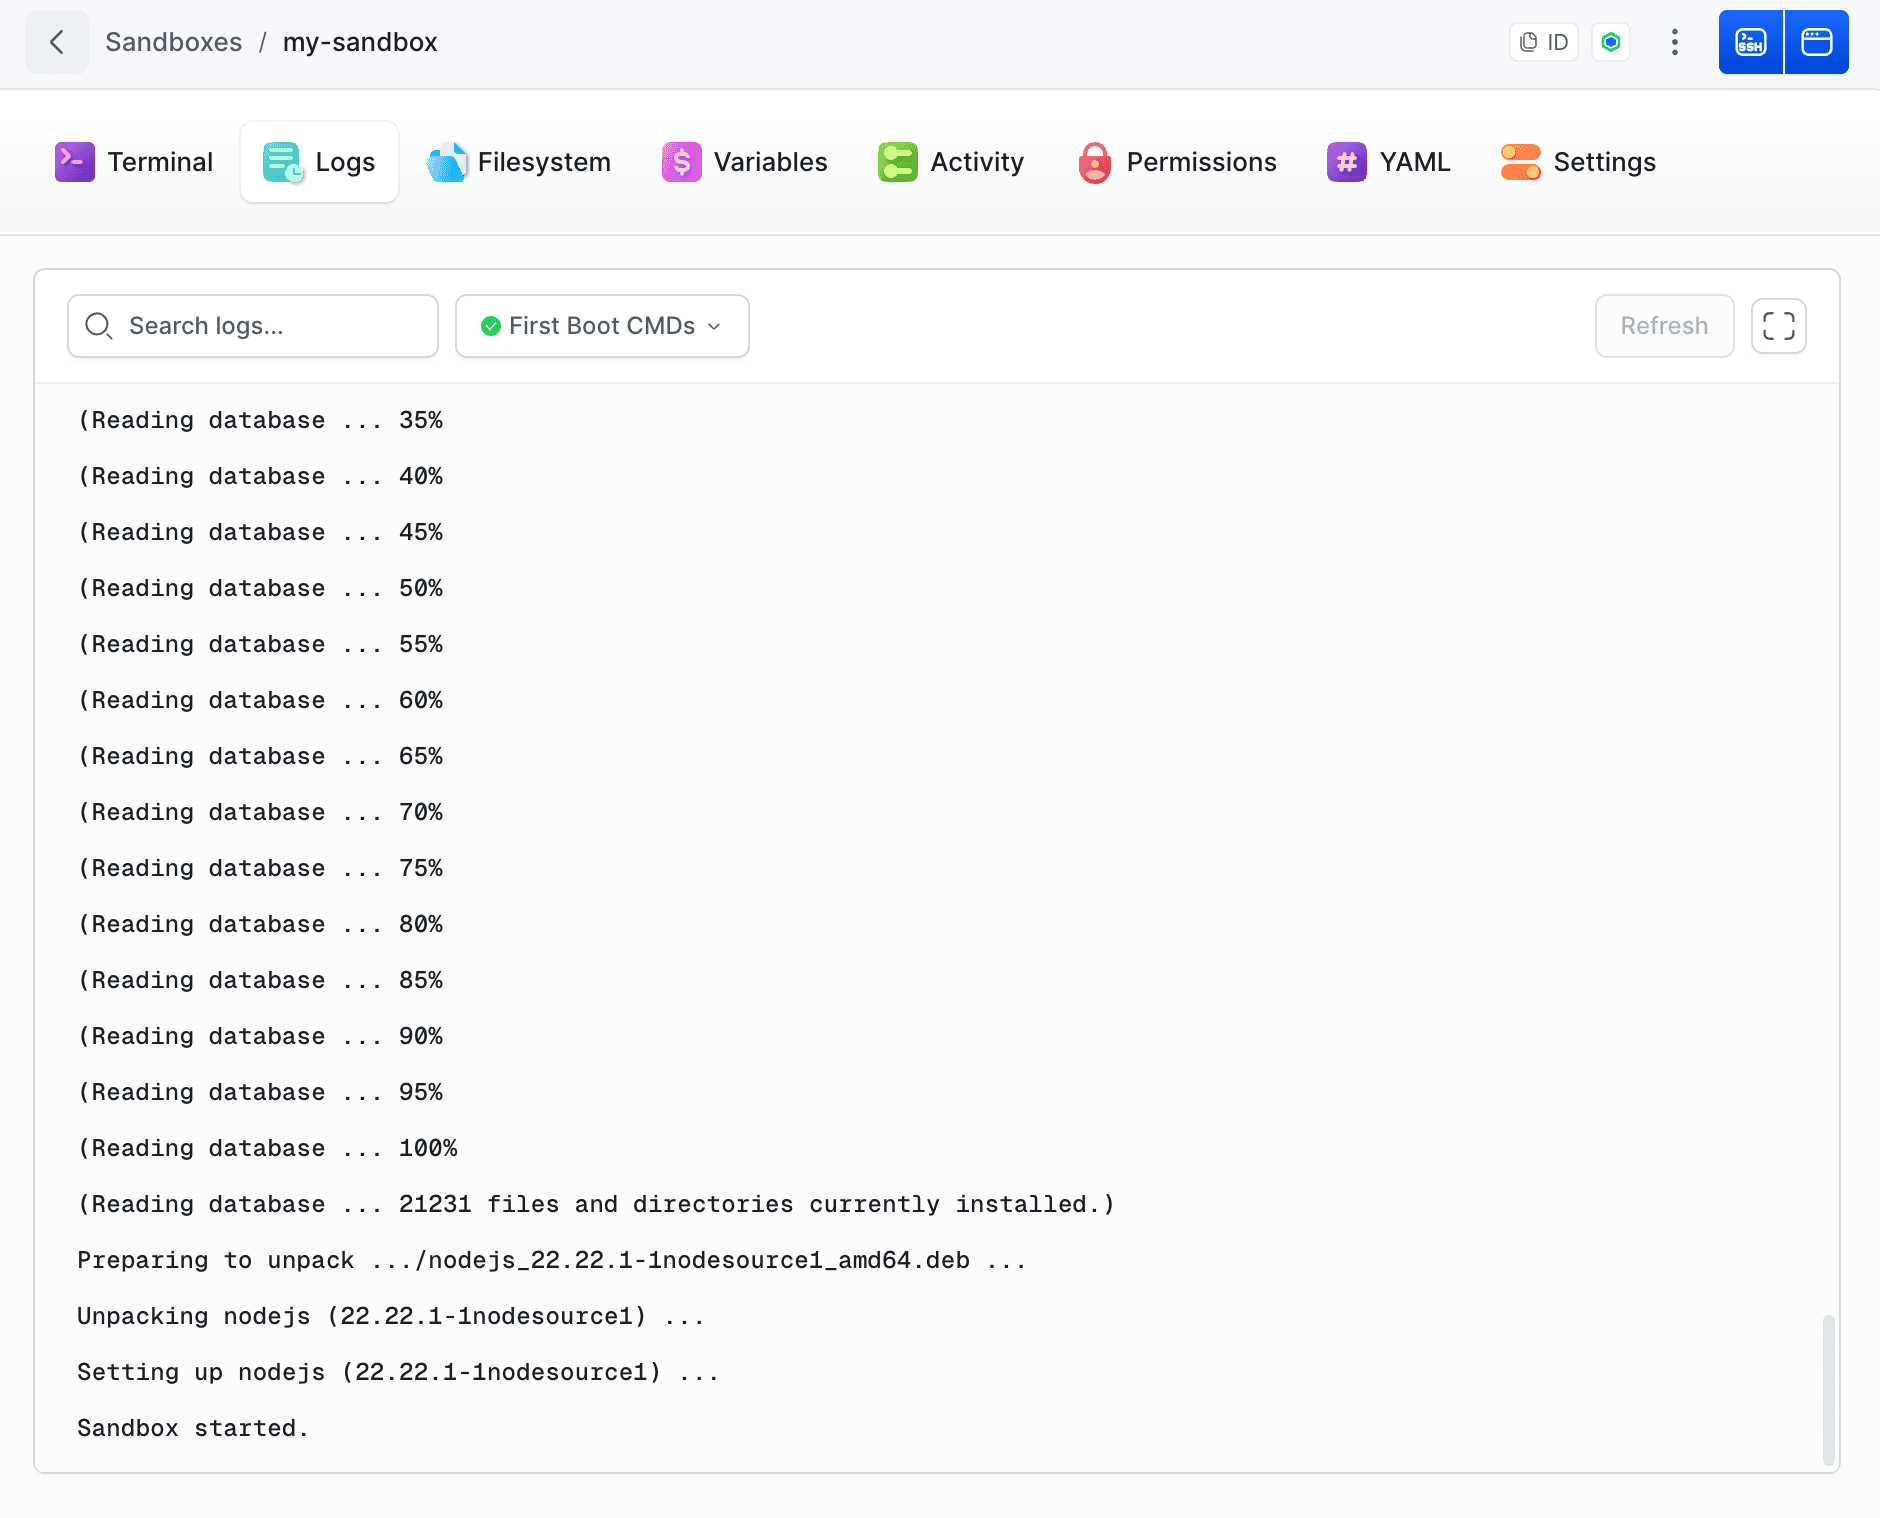
From the CLI:
bashbdy sb logs my-sandbox$
A Sandbox that comes up with no application running usually shows the reason here: a failed apt-get, a build command that exited non-zero, or a repository that was never cloned. It does not contain application output — that has its own log.
App logs
Each app has a separate stream. The same Logs tab dropdown switches between apps and the Boot entry.
Image loading...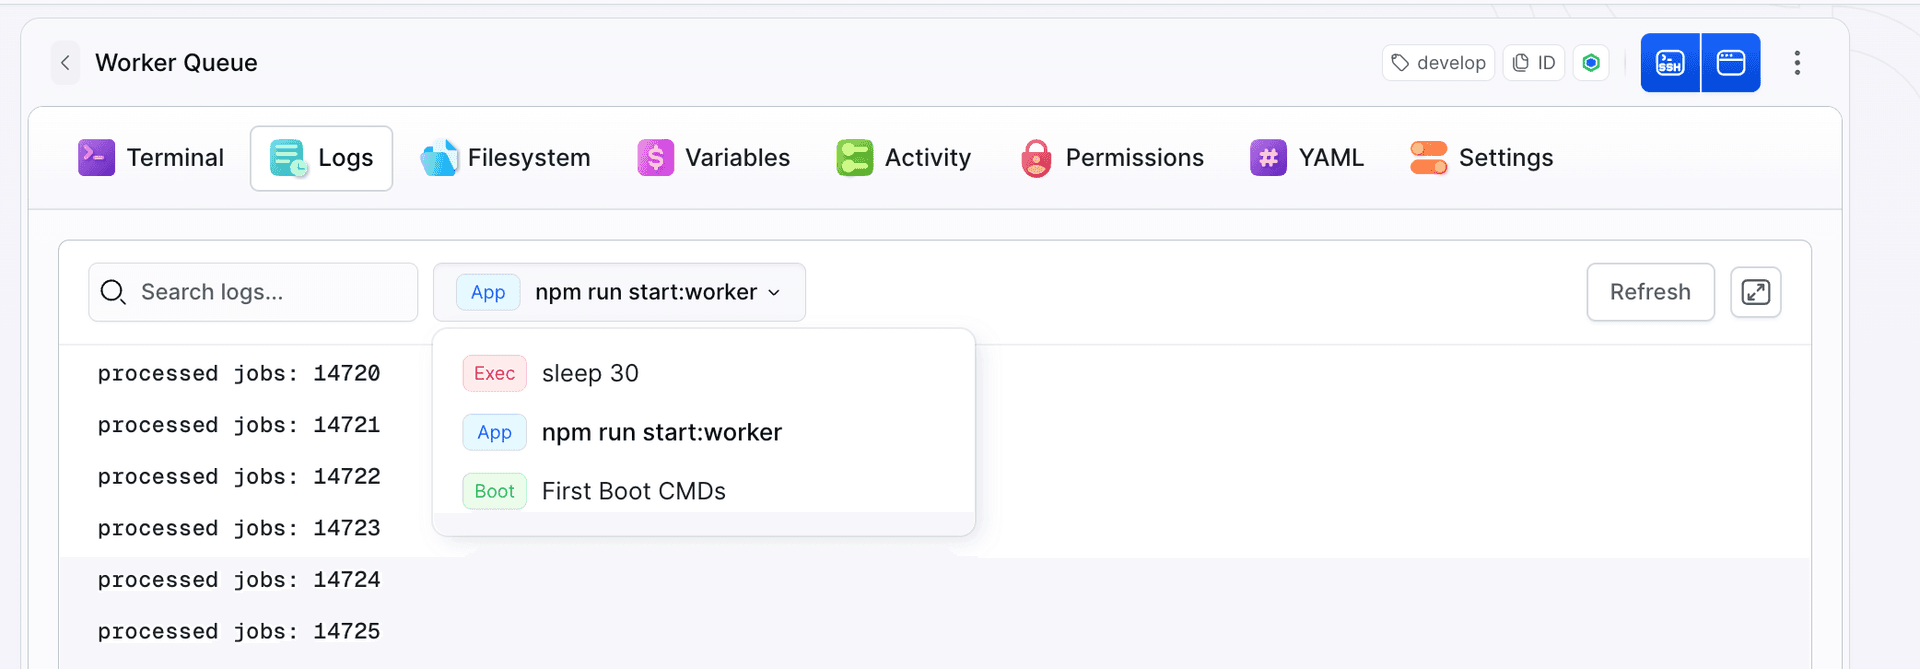
From the CLI:
bashbdy sb app logs my-sandbox <app>$
Command logs
Every executed command is recorded with its status, exit code, the runtime it ran in, and full output. The same Logs tab lists them under an Exec entry in the dropdown, so you can look back at what was run and what it printed.
Image loading...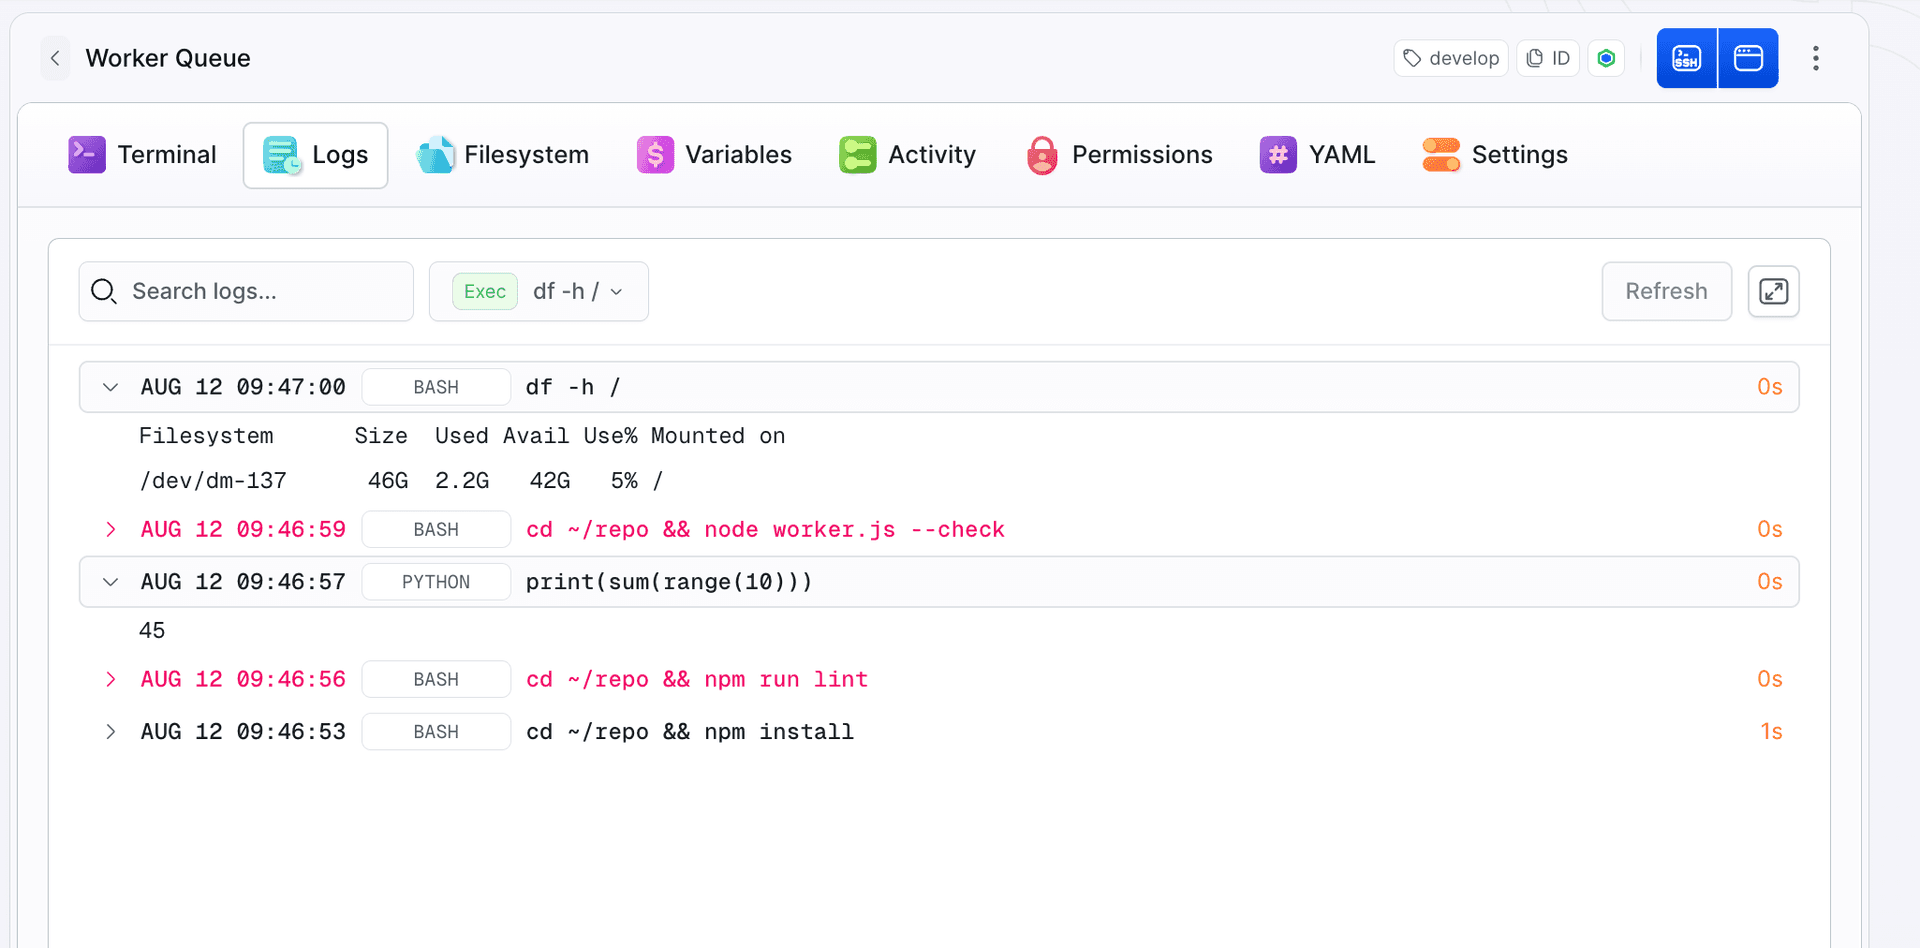
From the CLI, list them and read any one:
bashbdy sb exec list my-sandbox bdy sb exec logs my-sandbox <command-id>$$
Output can also be streamed live while the command is still running - see Running commands.
HTTP request logs
HTTP endpoints can log incoming requests. Open the endpoint from the Tunnels section and flip the Request logging flag in its settings. A Requests tab shows up on the endpoint view, and that is where you read the log.
Request logging shows whether traffic is reaching the Sandbox at all. Requests appearing in the list mean the endpoint is fine and the problem sits in the application; an empty list points to the endpoint itself.
Image loading...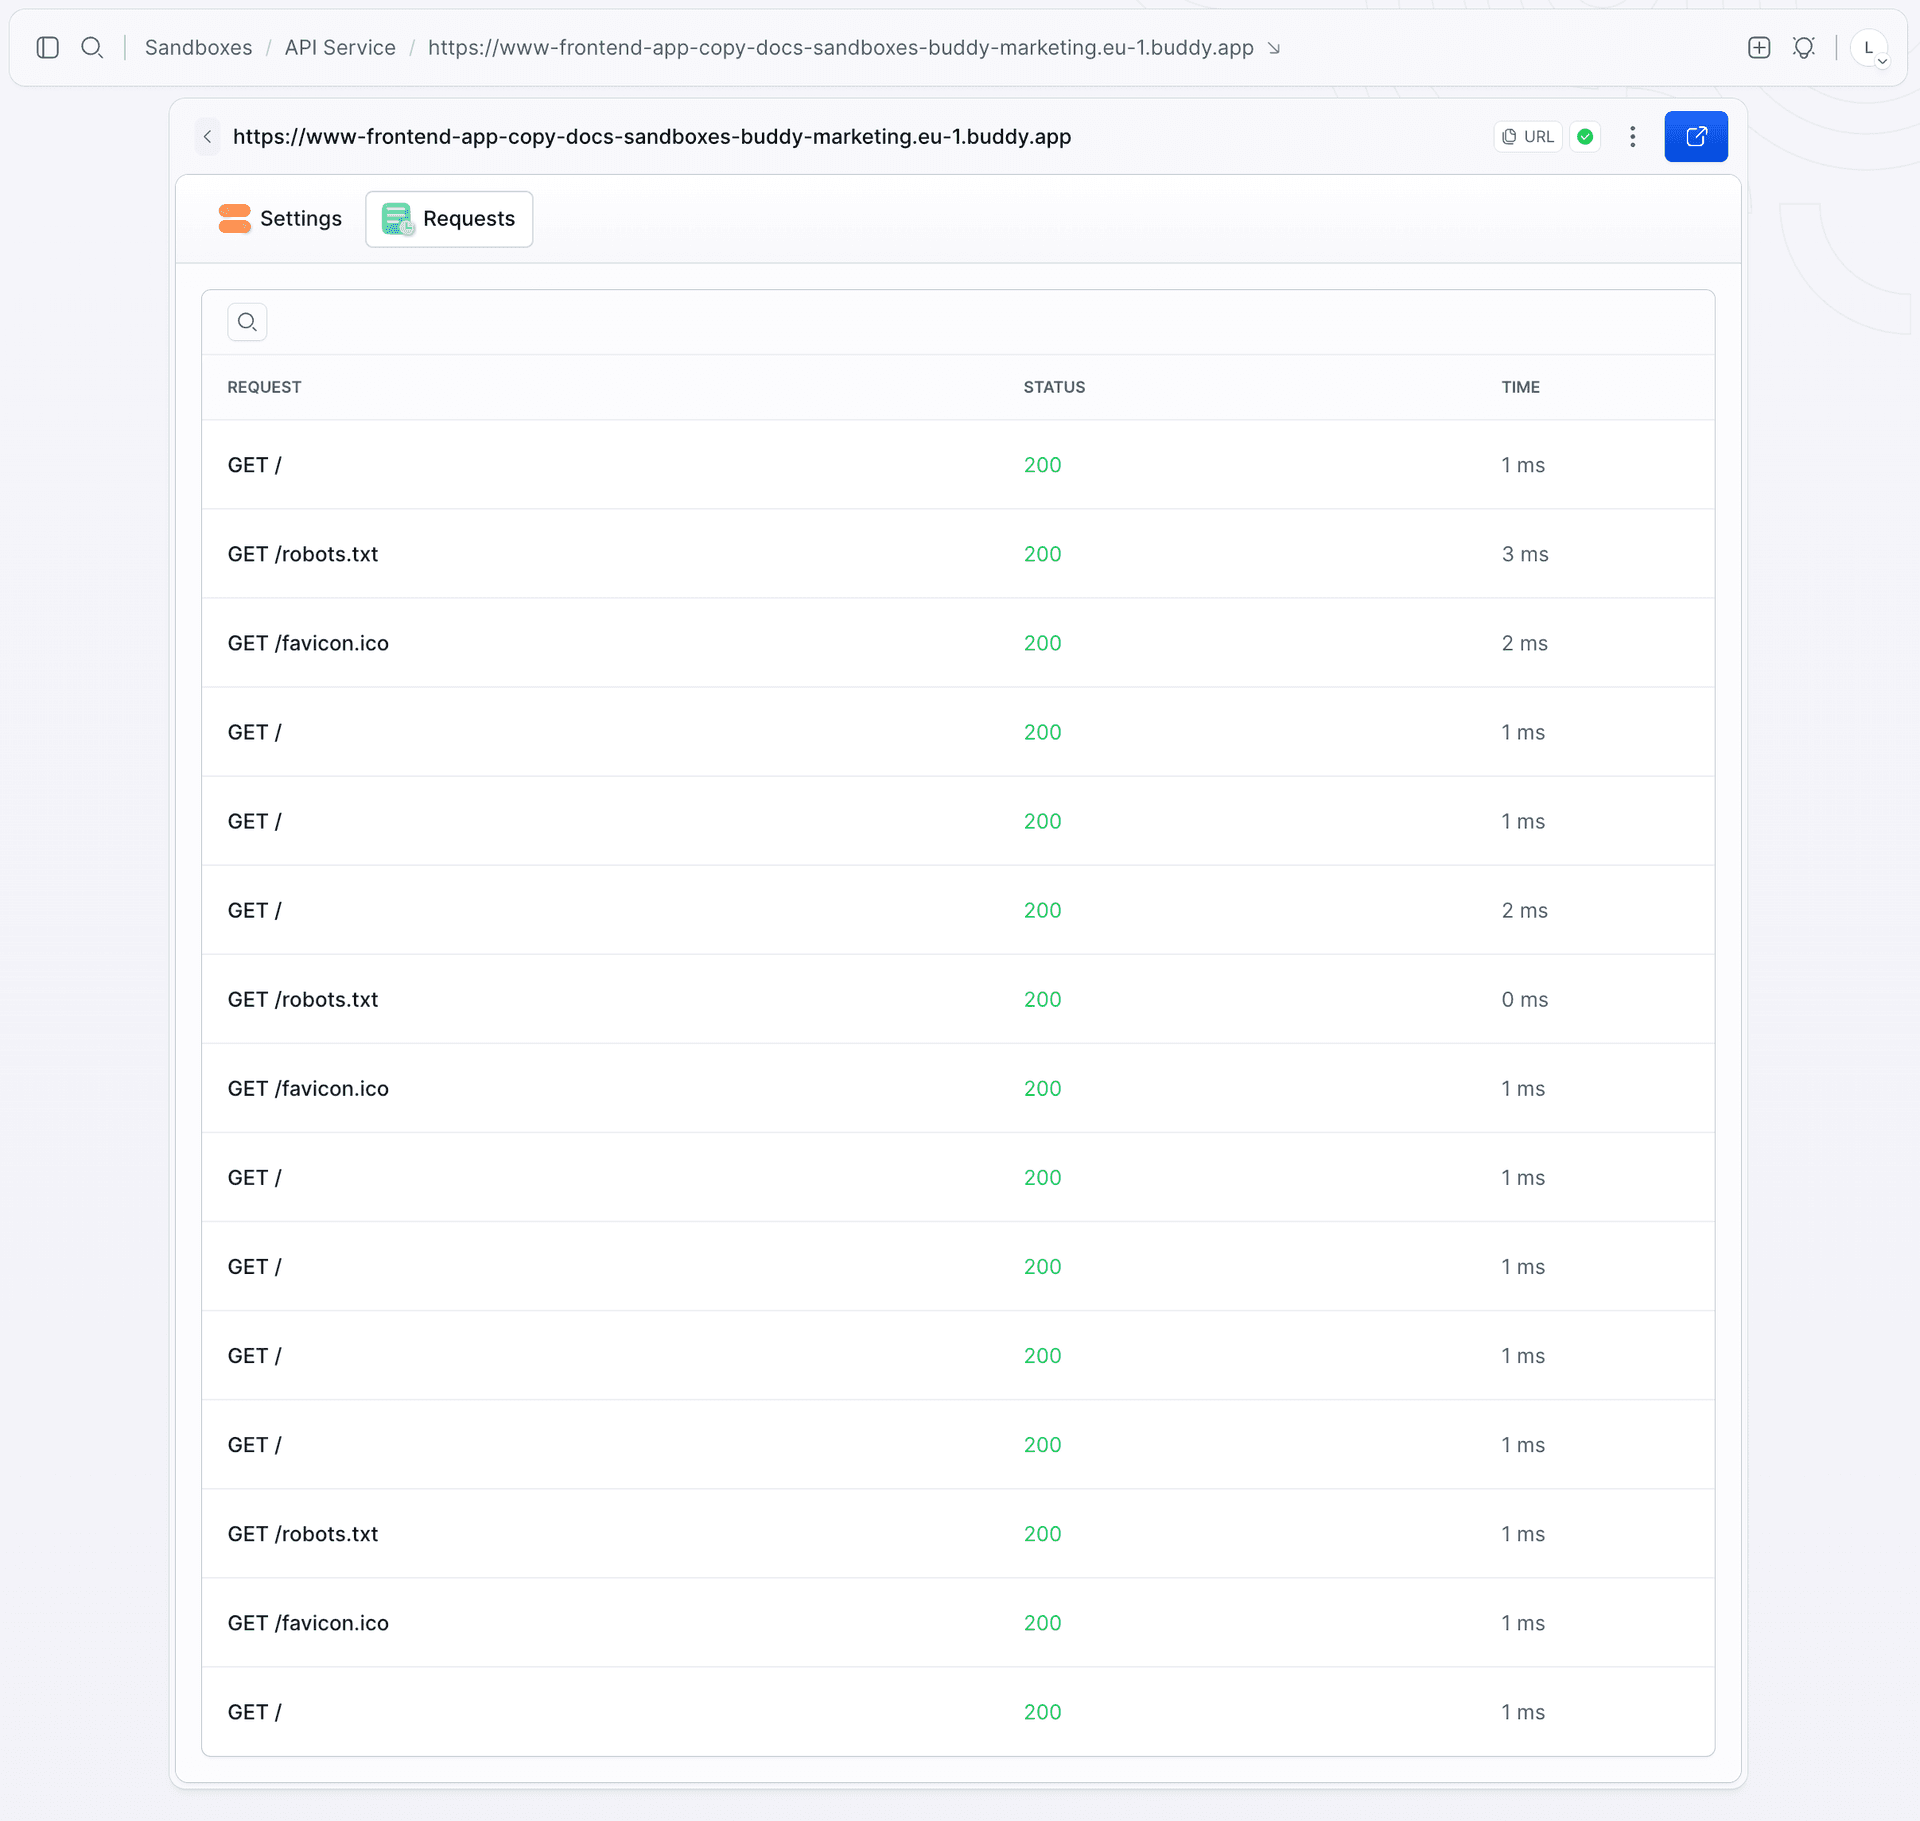
Activity
The Activity tab is the audit trail: it records lifecycle operations - who started, stopped, or deleted the Sandbox, and what was executed in it. Use it to answer "who changed this machine and when". Access rules themselves are covered in Permissions and security.
Image loading...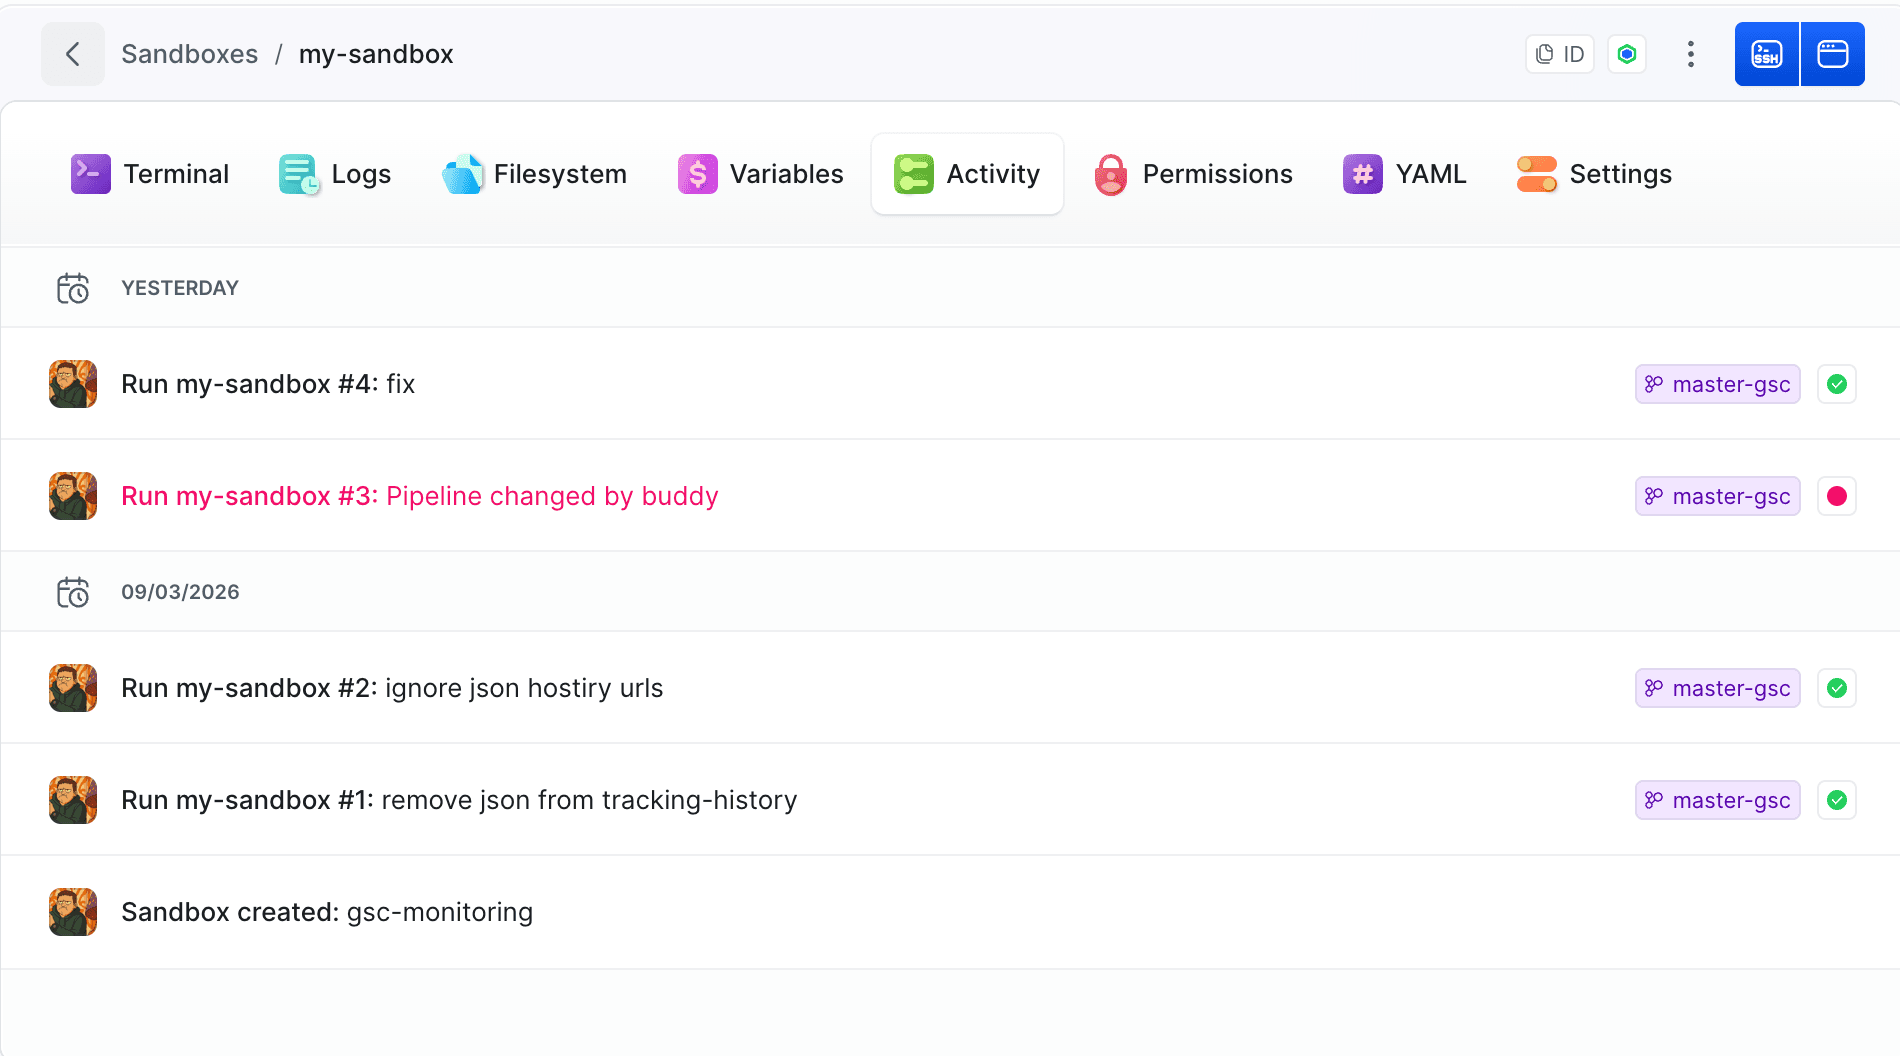
Which log do I open?
| Symptom | Start here |
|---|---|
| Sandbox is up, app is missing | Setup log |
| App crashes or restarts | App log |
| A script did not do what you expected | Command log |
| The URL returns an error | Request logging on the endpoint, then the app log |
| Something changed and nobody knows who | The Activity tab |
More symptoms and fixes in Troubleshooting.
Last modified on Oct 7, 2026