Viewing Results, Flaky & Slow Tests
Sessions Tab
Each test run creates a session. The Sessions tab displays a list of all test execution sessions, grouped by date (e.g., “TODAY”). Each session shows:
- Commit message
- Session number (e.g., #5, #4, #3)
- Result summary:
- Failed tests (red X icon)
- Passed tests (green checkmark)
- Skipped tests (double arrow icon)
- Total number of tests (asterix icon)
- Success rate (percent icon)
Image loading...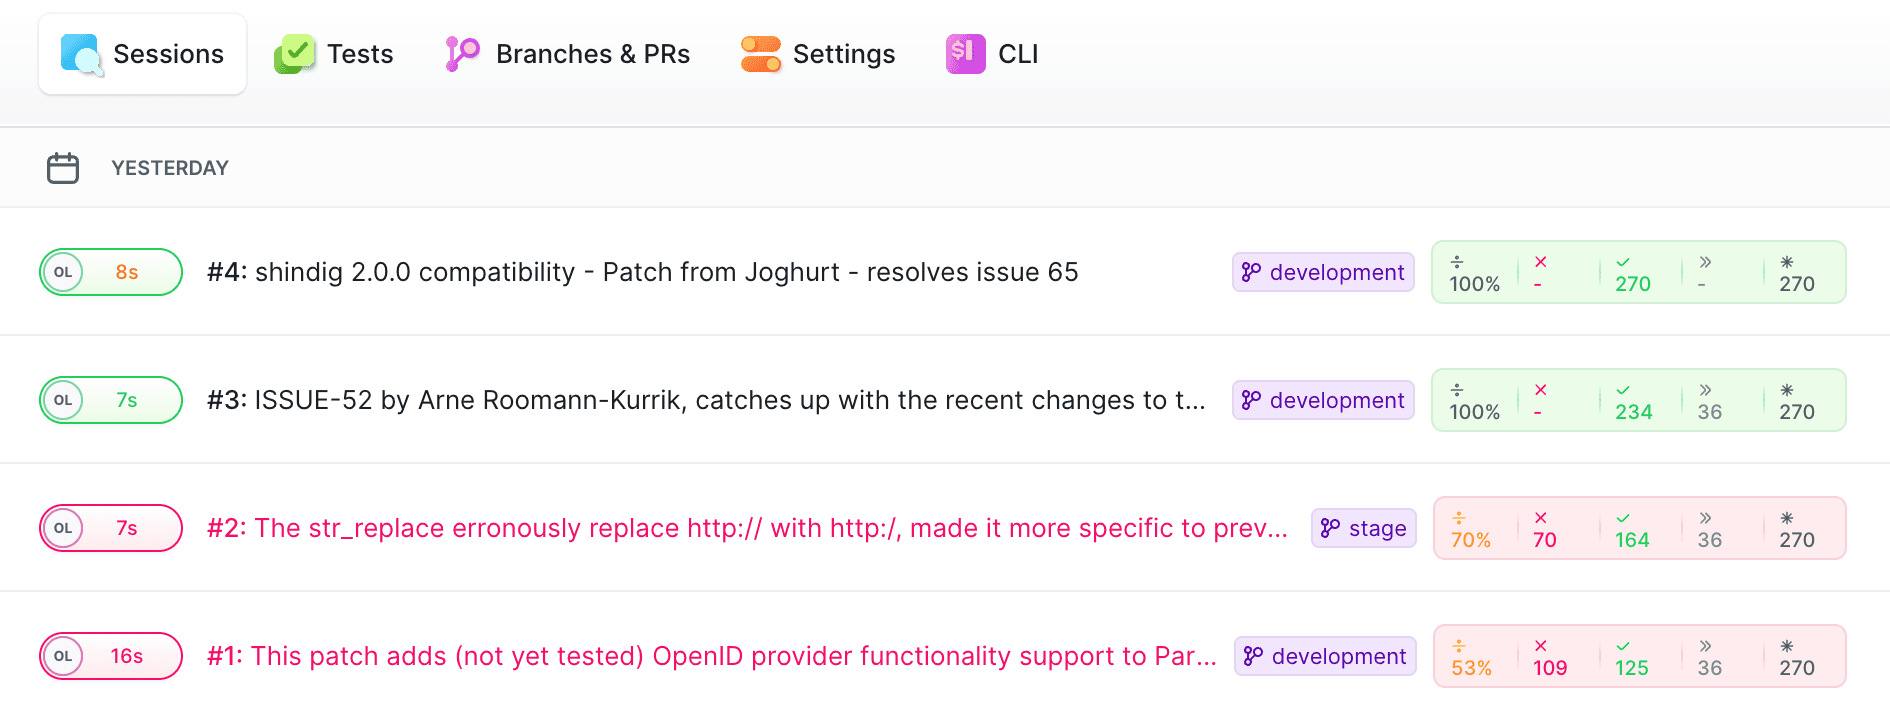
Sessions are useful for tracking what happened in a specific commit, branch, or pull request.
Flaky & Slow Tests
Flaky Detection
Buddy analyzes the last 10 sessions to detect flaky tests. If a test changes its status 3 or more times (skipping ignored), it is marked as flaky.
Image loading...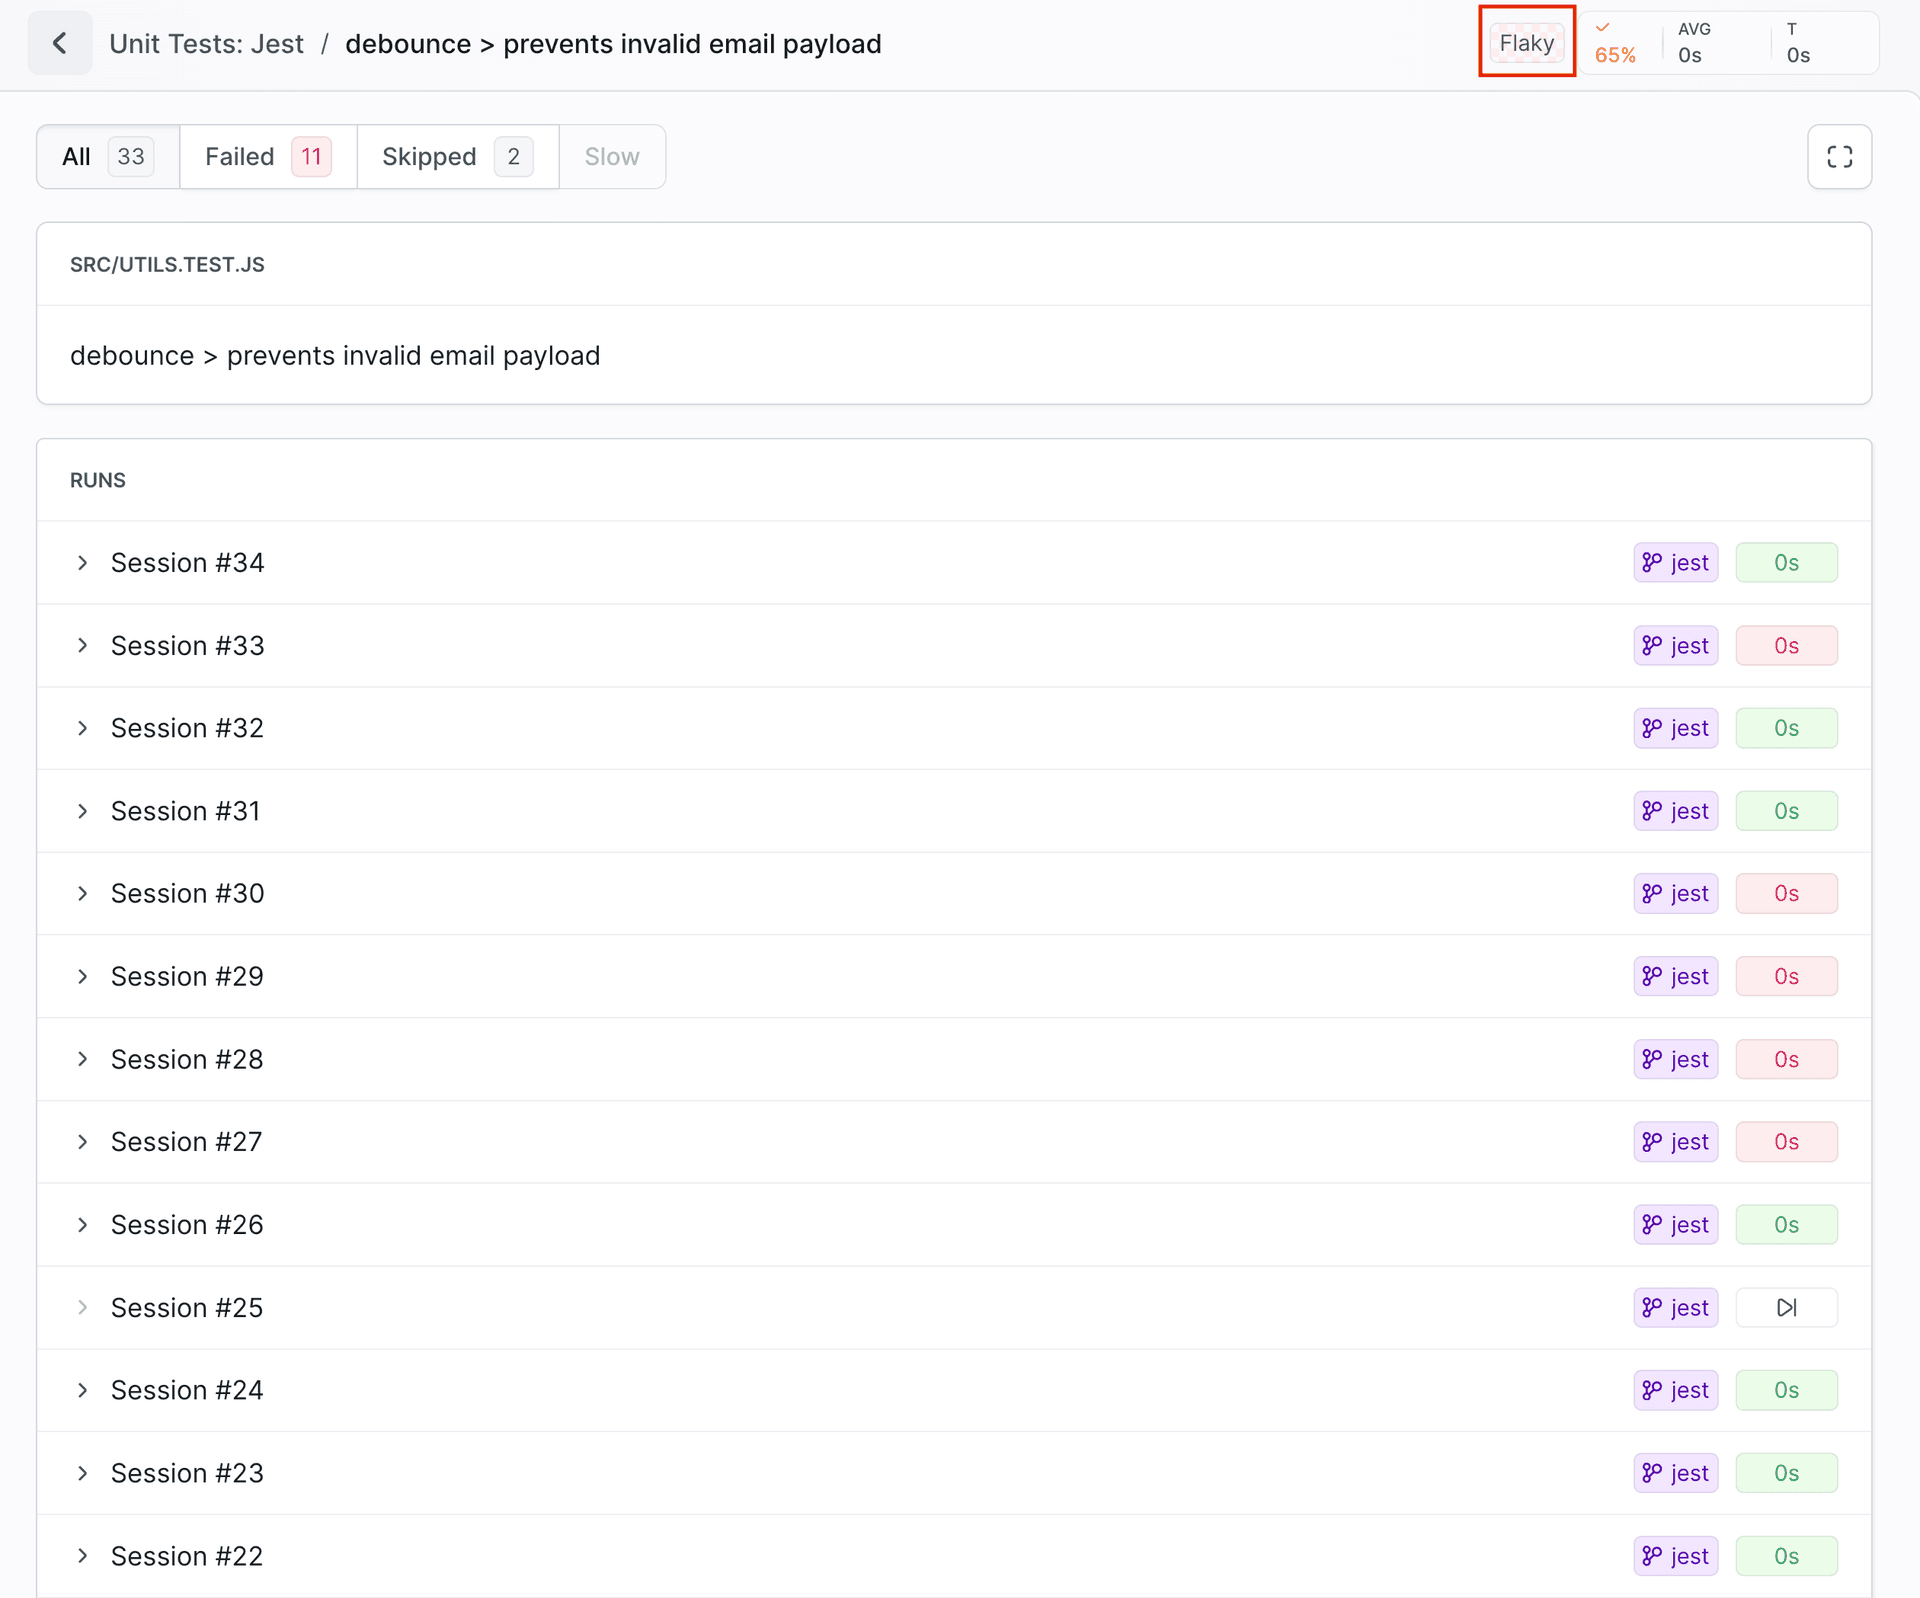
Slow Tests
Any test that exceeds the configured slow-test threshold is marked as slow.
Tests Tab
The Tests tab provides a comprehensive view of all individual test cases, with filtering and sorting options:
Filtering options:
- Sort by: Name, Status, Success rate, Average time
- Group by: None or Test Group
- Status filters: All, Failed, Skipped, Slow, Flaky
- Timeframe: Last 24h, 7 days, 2 weeks or 1 month
Every test entry displays:
- Test file path (e.g.,
tests/basic.spec.js) - Test description (e.g.,
Mobile Chrome > basic.spec.js > User Authentication > login form validation) - Status indicators:
- Success rate (✓ 100%, ✓ 50%, etc.)
- Average execution time (AVG)
- Last execution time (T)
- Badge Slow or Flaky
Image loading...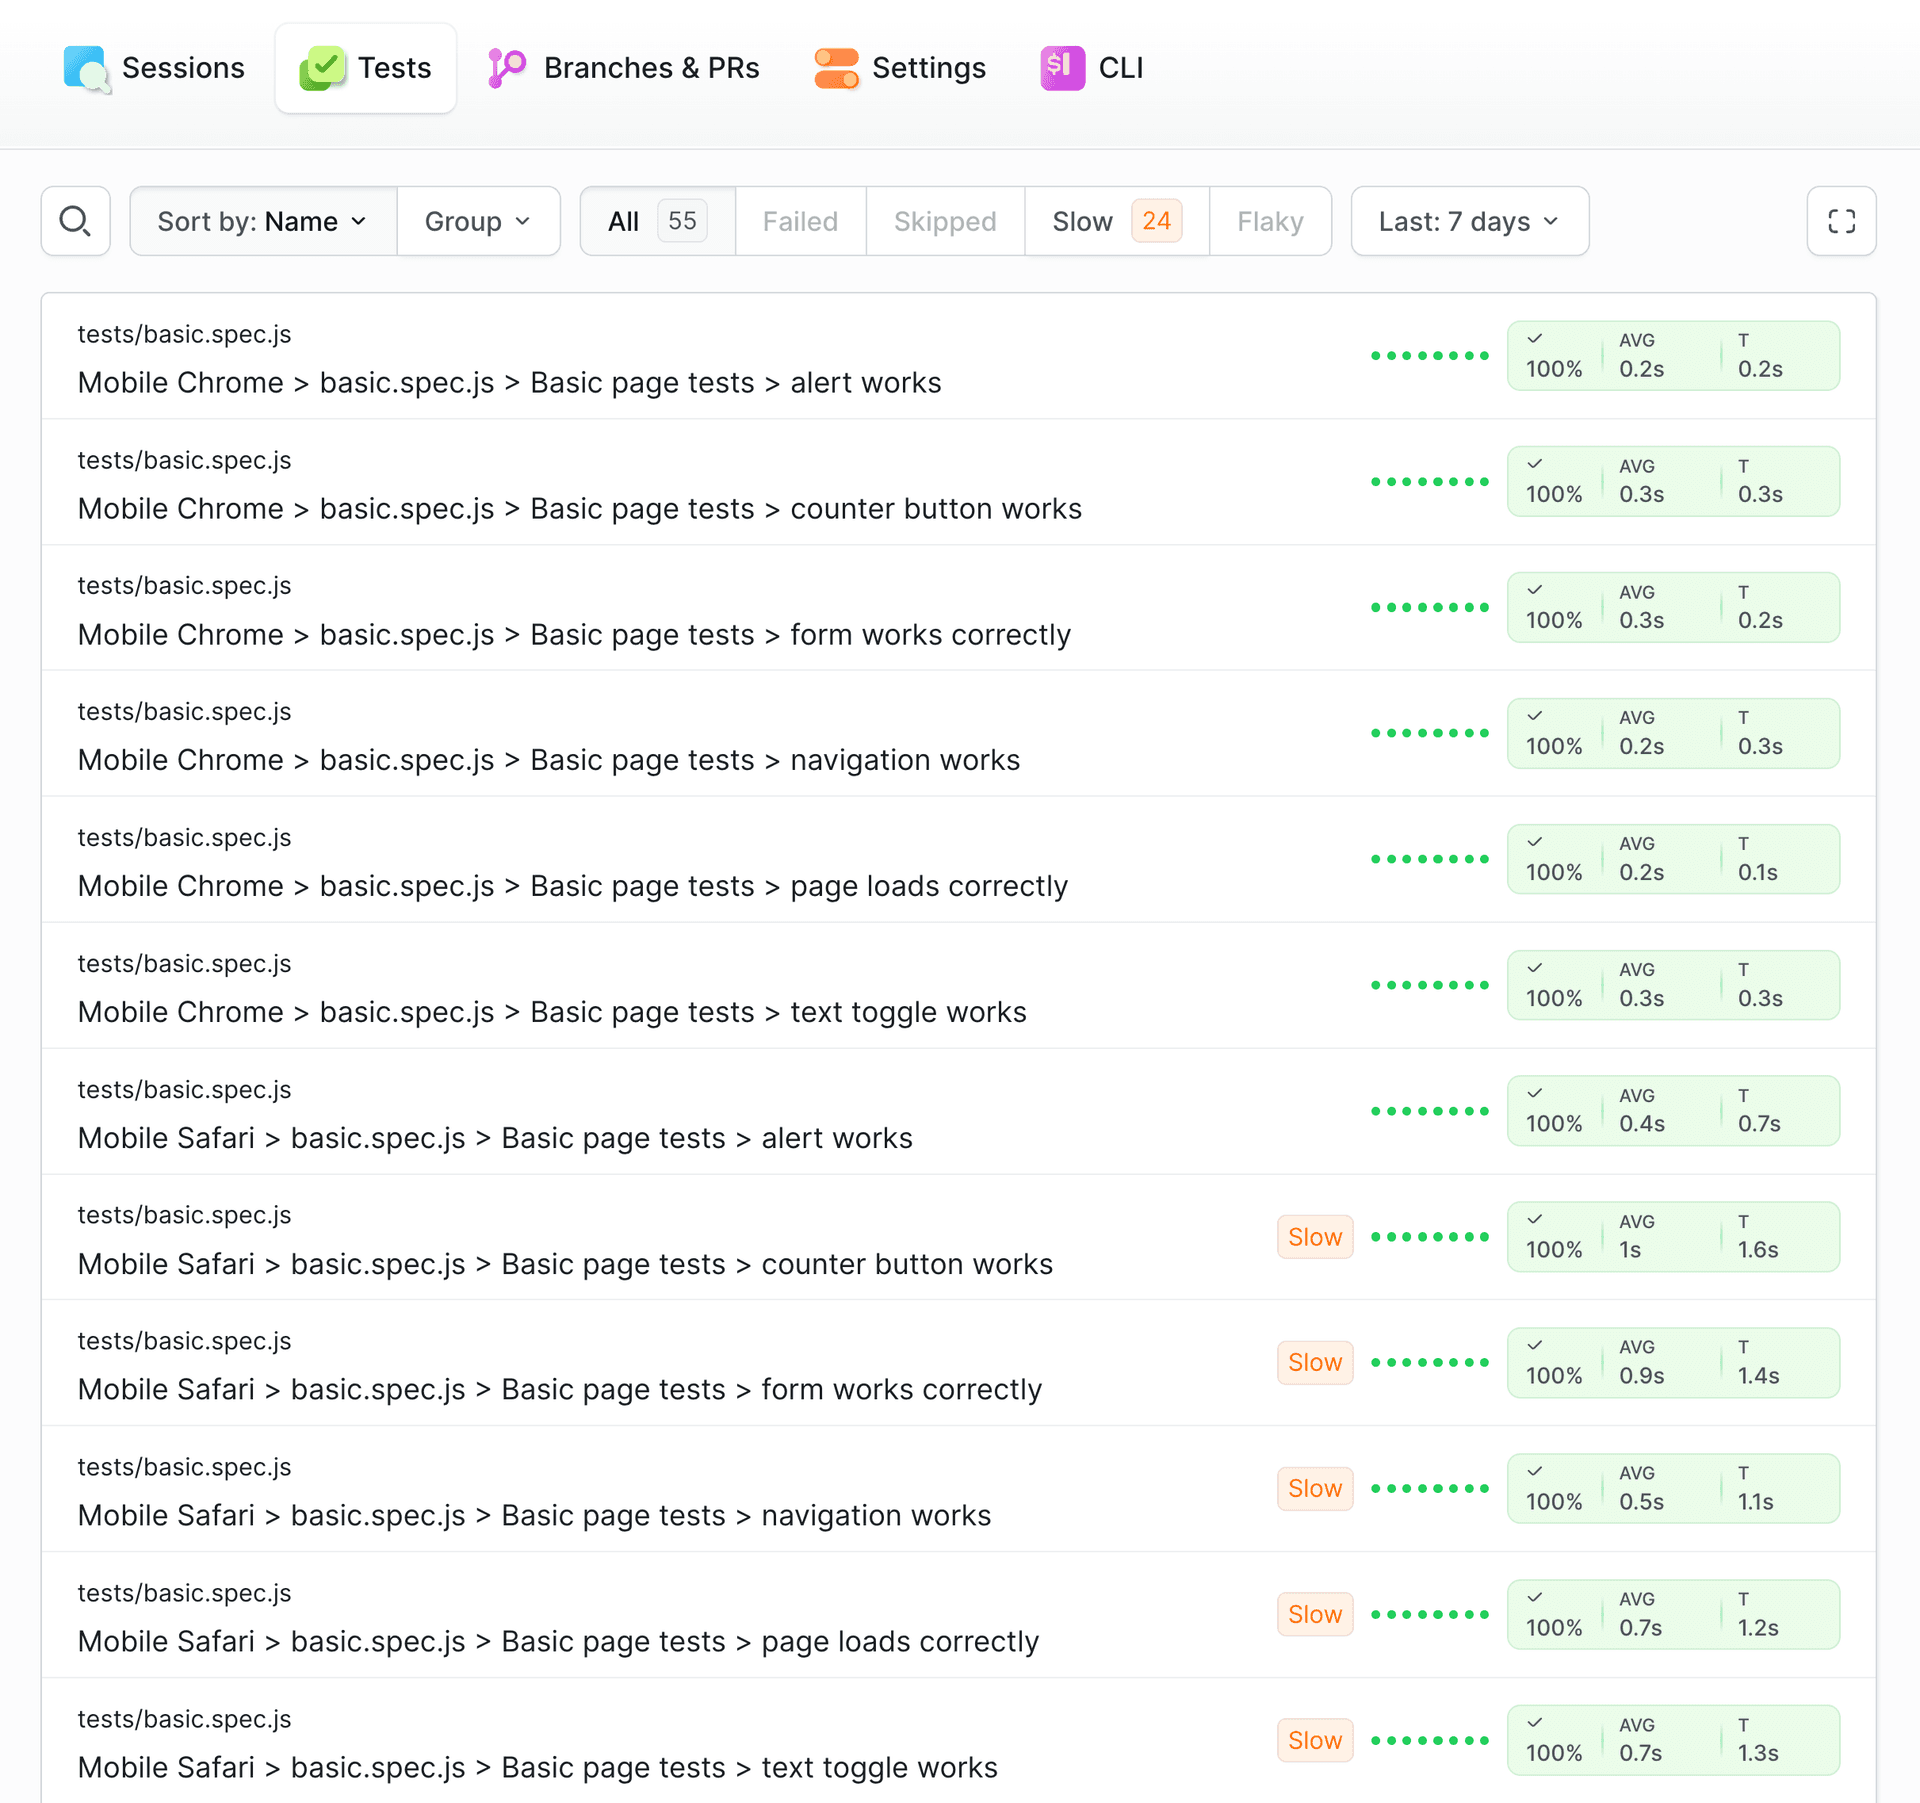
Individual Test Details
- File path and description (e.g.,
tests/basic.spec.js > Mobile Chrome > basic.spec.js > Basic page tests > alert works) - Test run time (e.g., 0.1s)
- Run information: Run number (e.g., Run #17), name and hash of the commit
- Trigger: Who and when executed the test
- Runs history: Redirects you to the tests history
- Data view tabs: Error, Flattened, JSON, Raw
Image loading...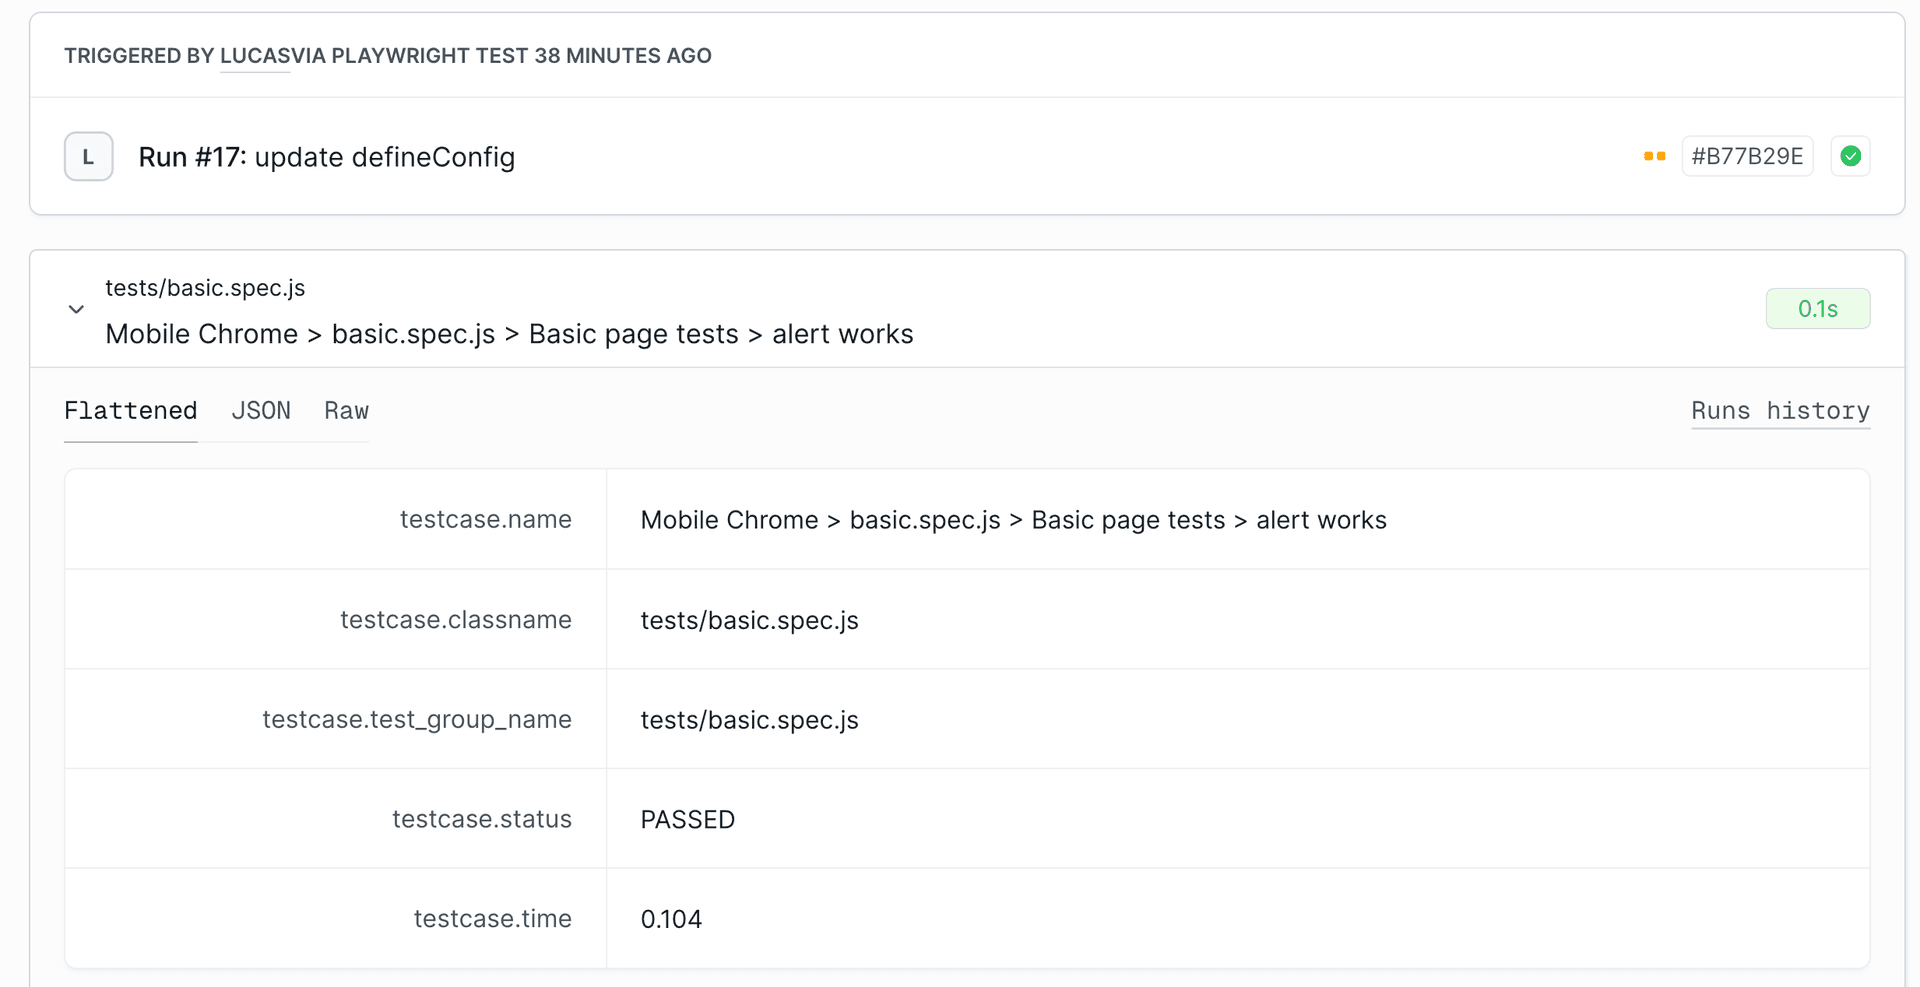
Session Details
When viewing a specific session, you can check detailed information about the tests through four tabs:
Error Tab: Displays formatted error messages according to the ERROR PATTERN template configured in the Suite Settings. For failed tests, it shows the Failure Message and StackTrace.
Image loading...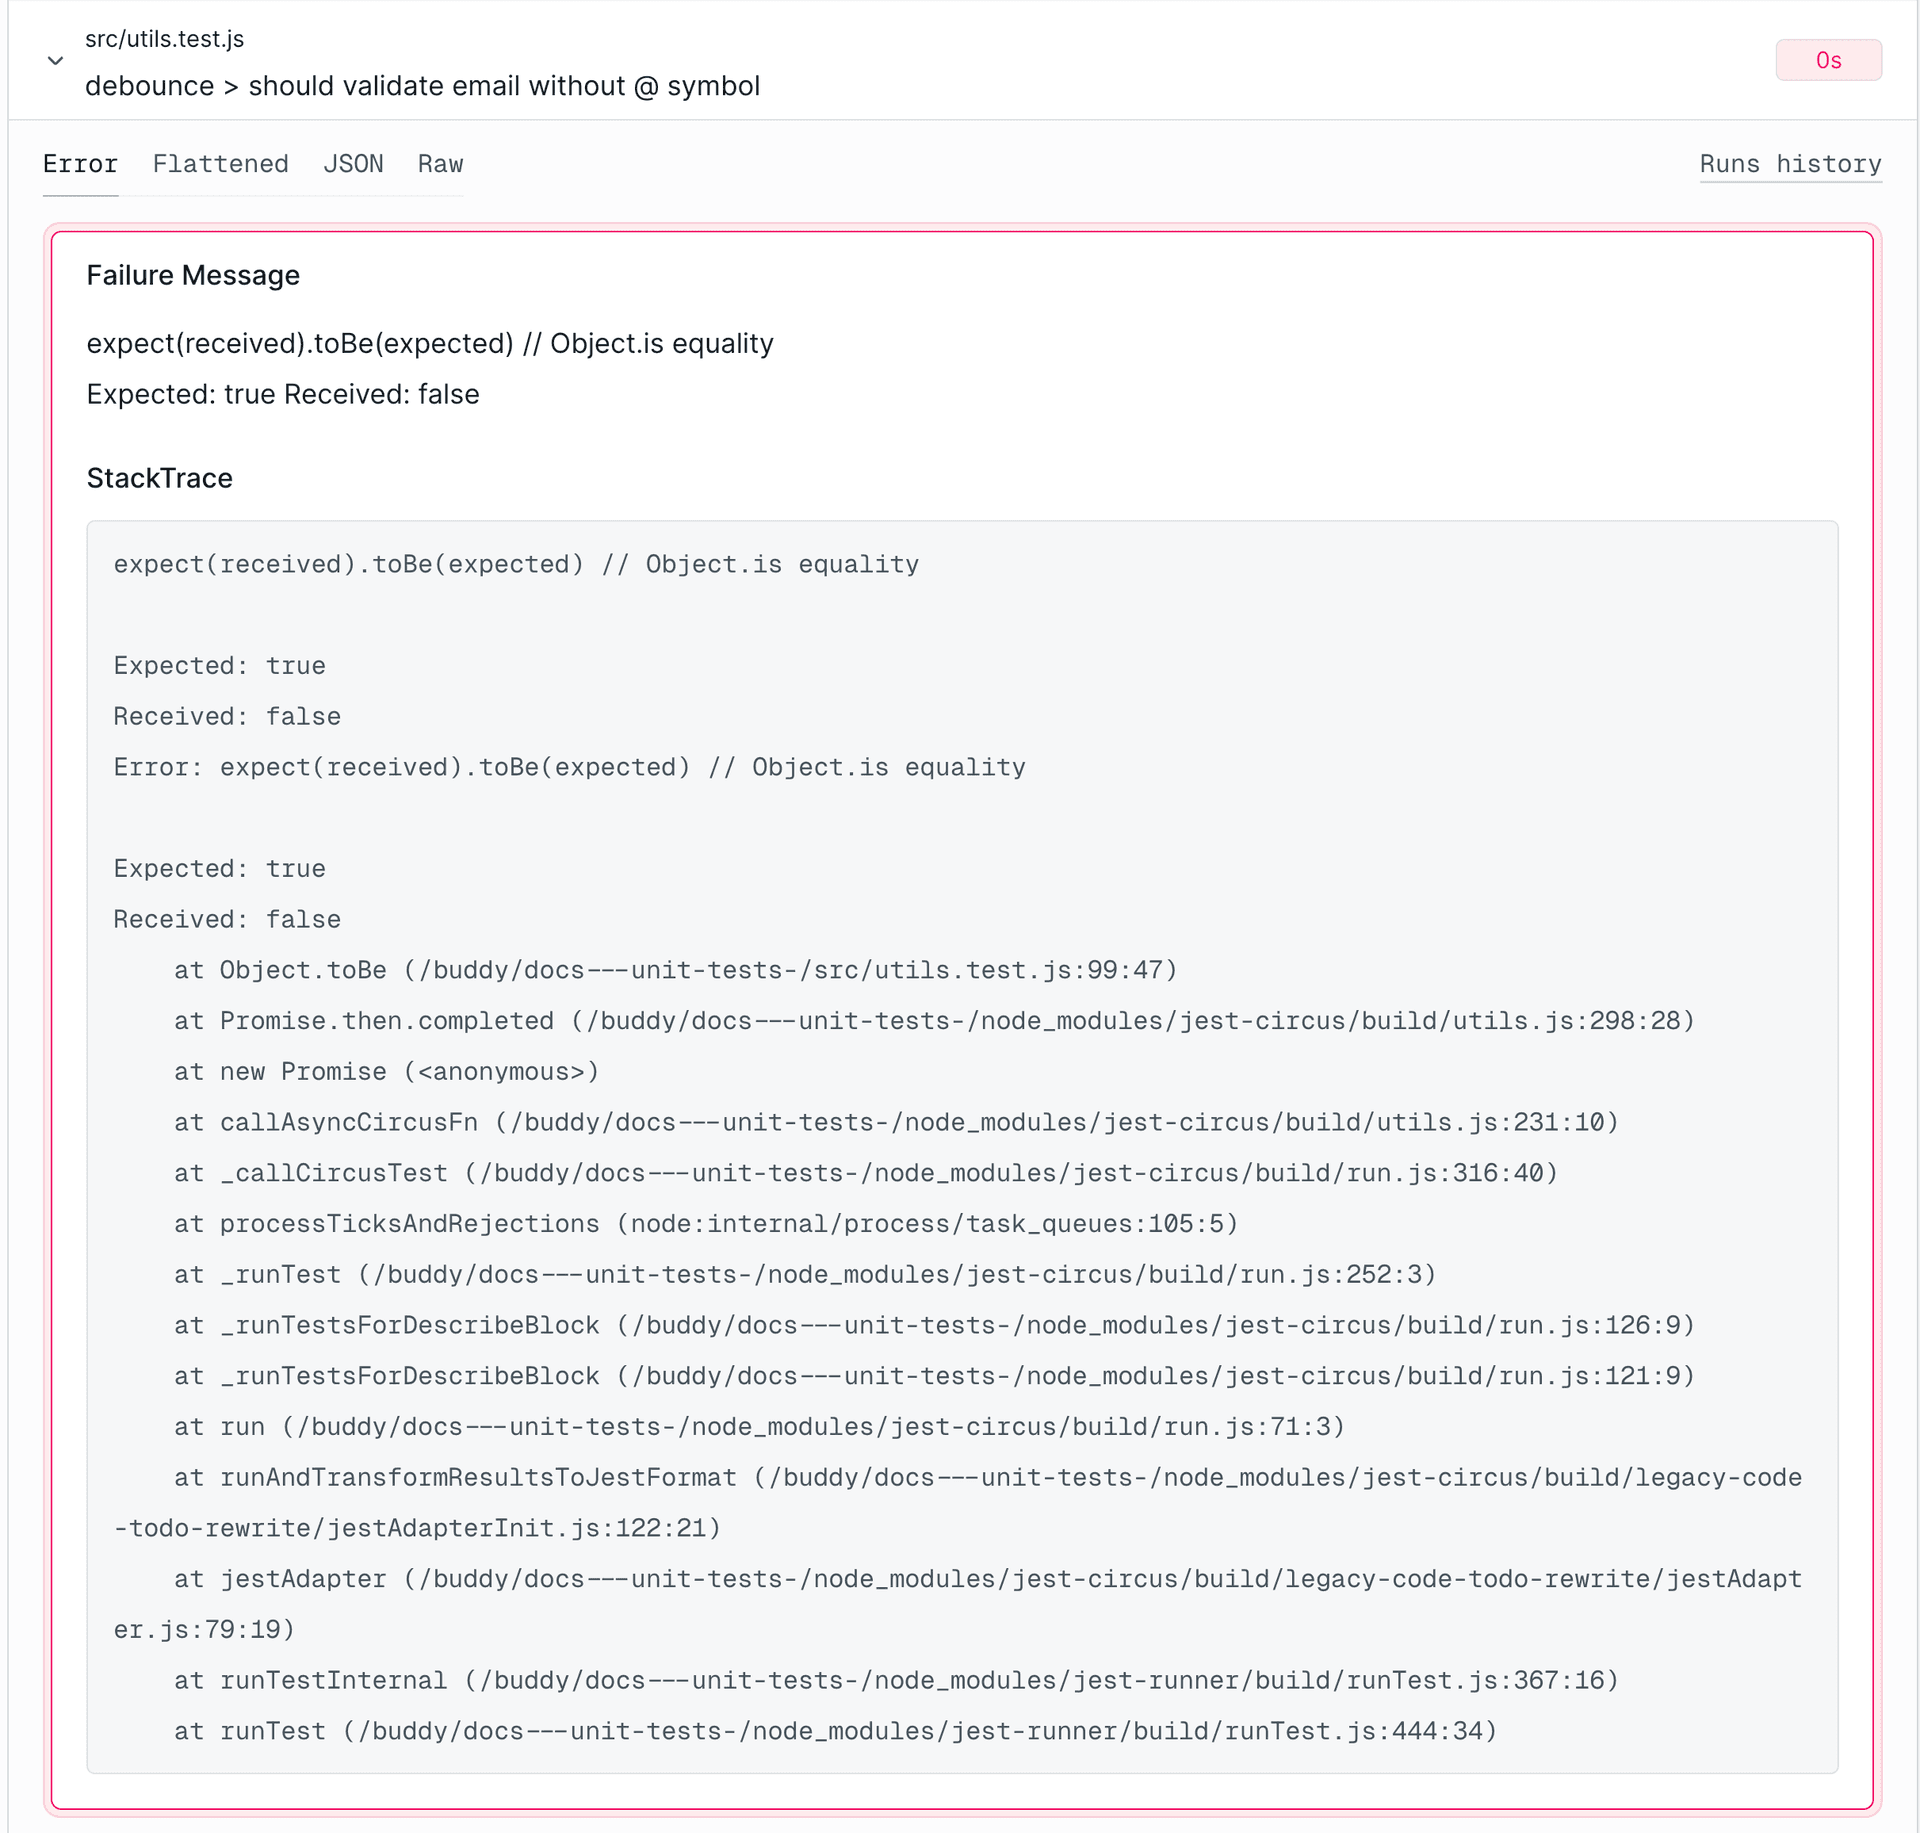
Flattened Tab: Displays the test data in a key–value table format, making it easy to scan the details. The available keys may vary depending on the testing framework used. Key examples:
testcase.name- full name of the testtestcase.classname- test file pathtestcase.test_group_name- test group nametestcase.status- test status (e.g., "PASSED", "FAILED")testcase.time- test run time
Image loading...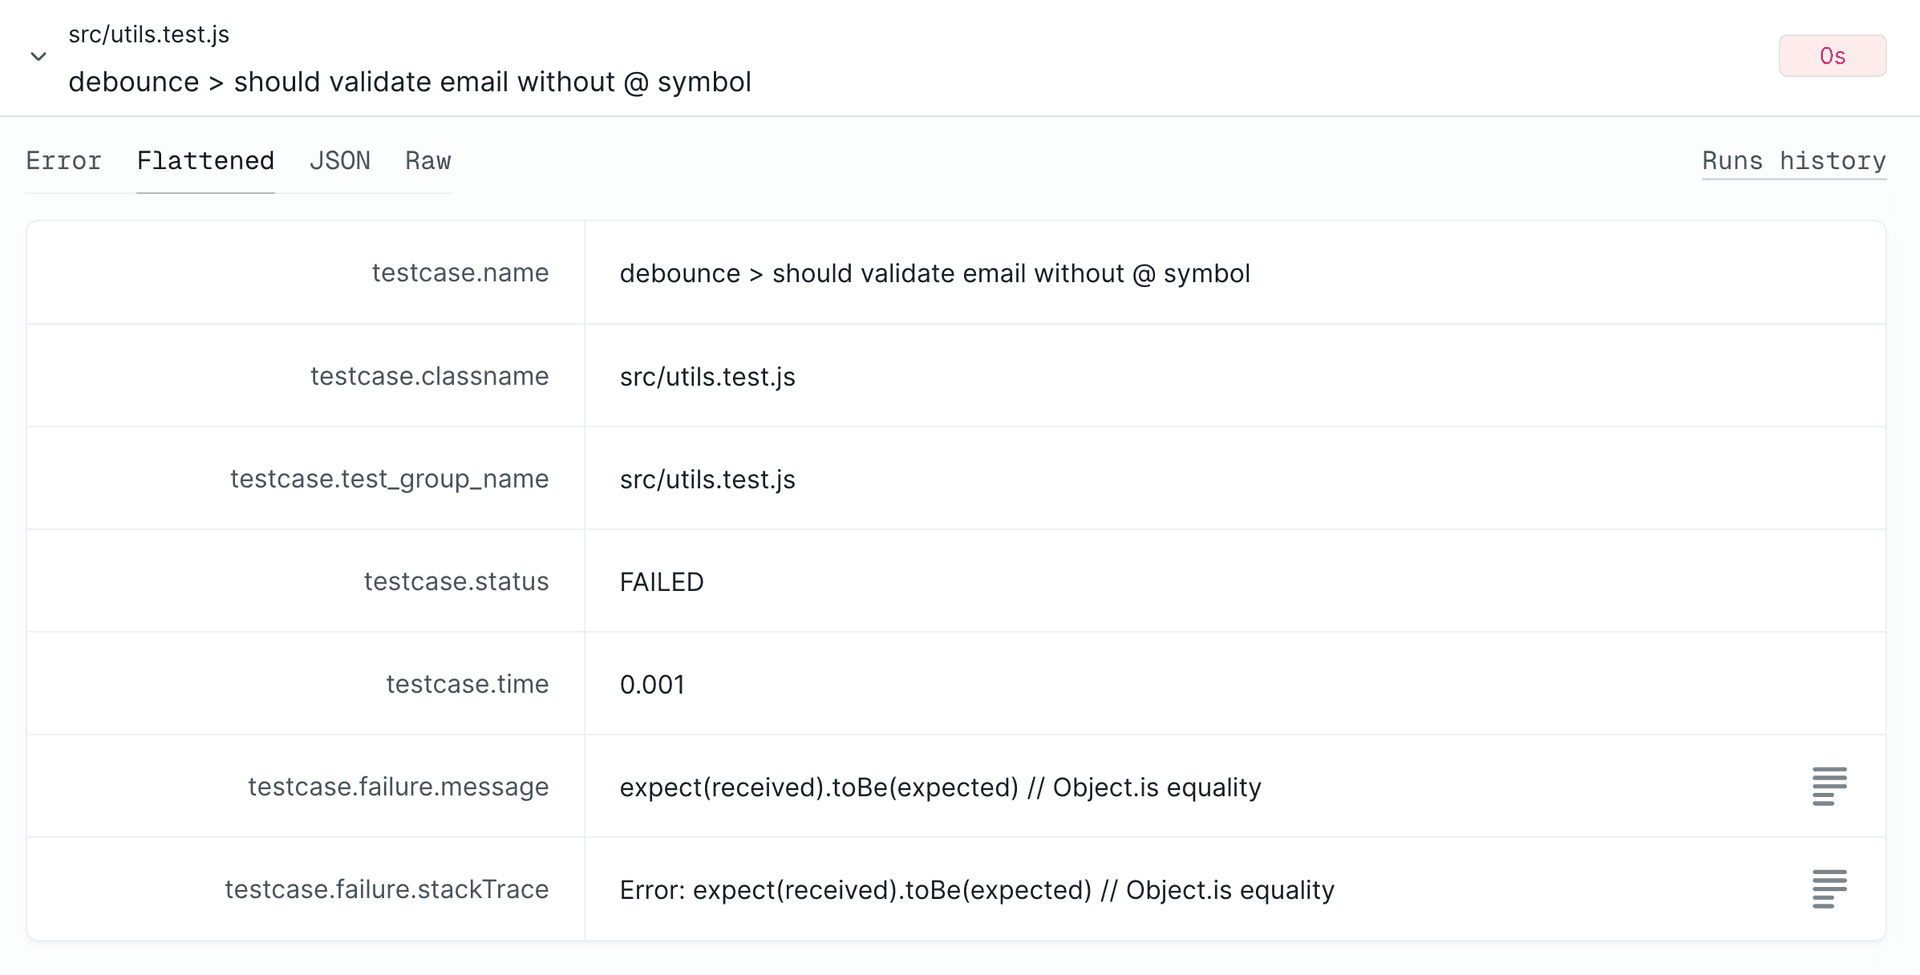
JSON Tab: Displays test information in a structured JSON format, useful for programmatic parsing. The format contains all test data in a clear JSON structure:
Image loading...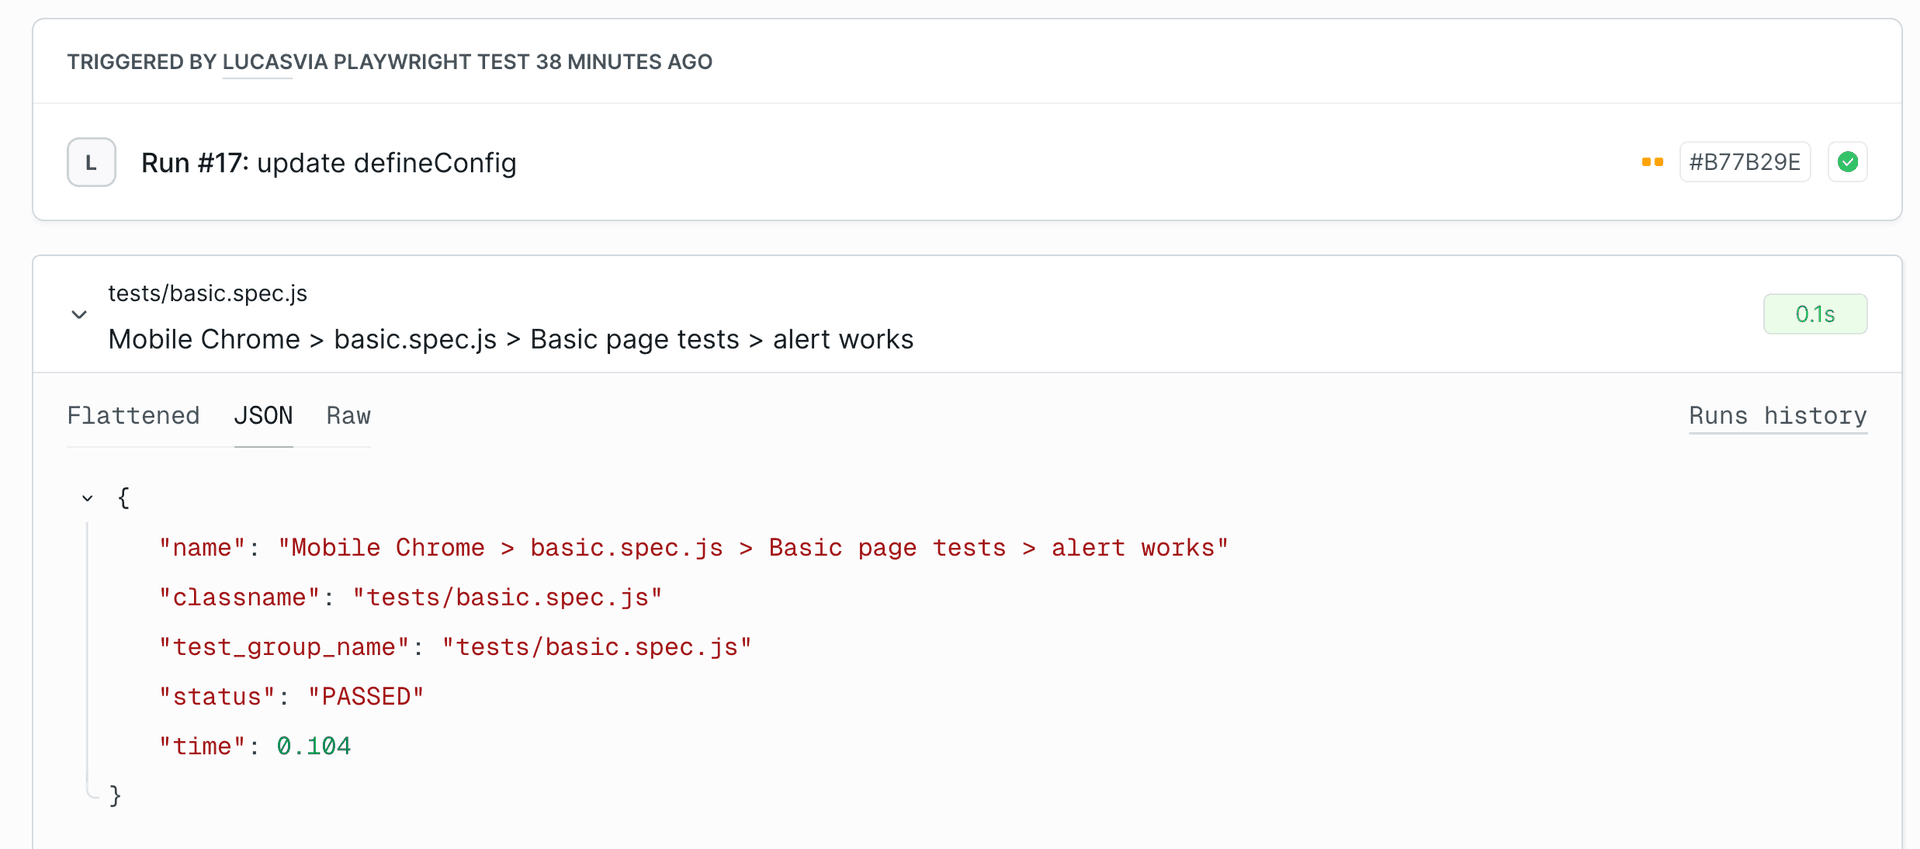
{
  "name": "Mobile Chrome > basic.spec.js > Basic page tests > alert works",
  "classname": "tests/basic.spec.js",
  "test_group_name": "tests/basic.spec.js",
  "status": "PASSED",
  "time": 0.104
}
Raw Tab: Displays the complete raw test data structure in unformatted JSON.
Image loading...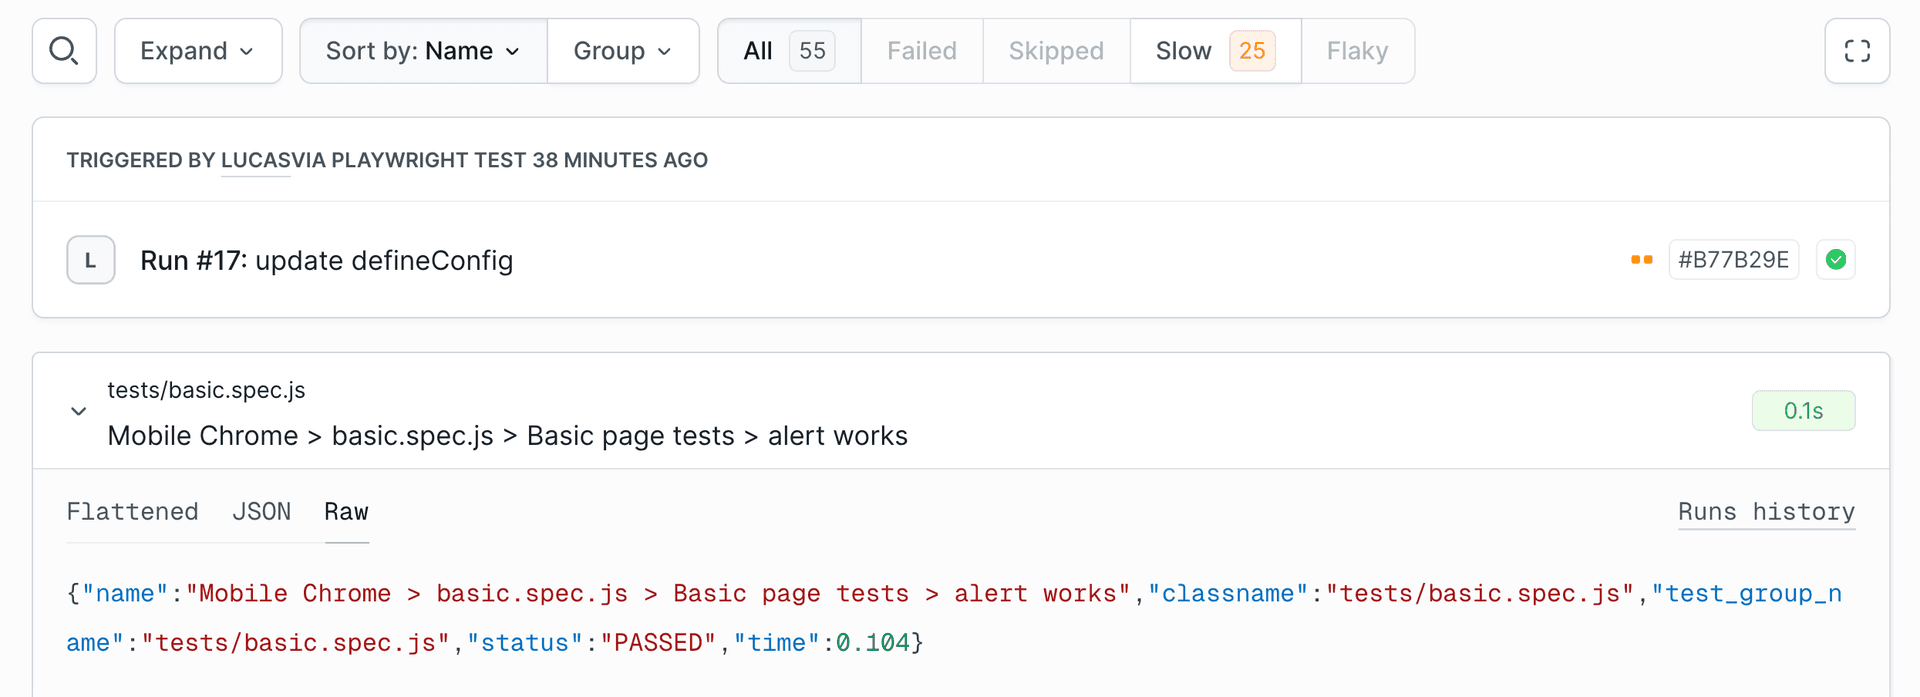
Branches & PRs
The Branches & PRs view shows the latest test status for each branch or pull request. This is useful for validating feature branches before merging.
Image loading...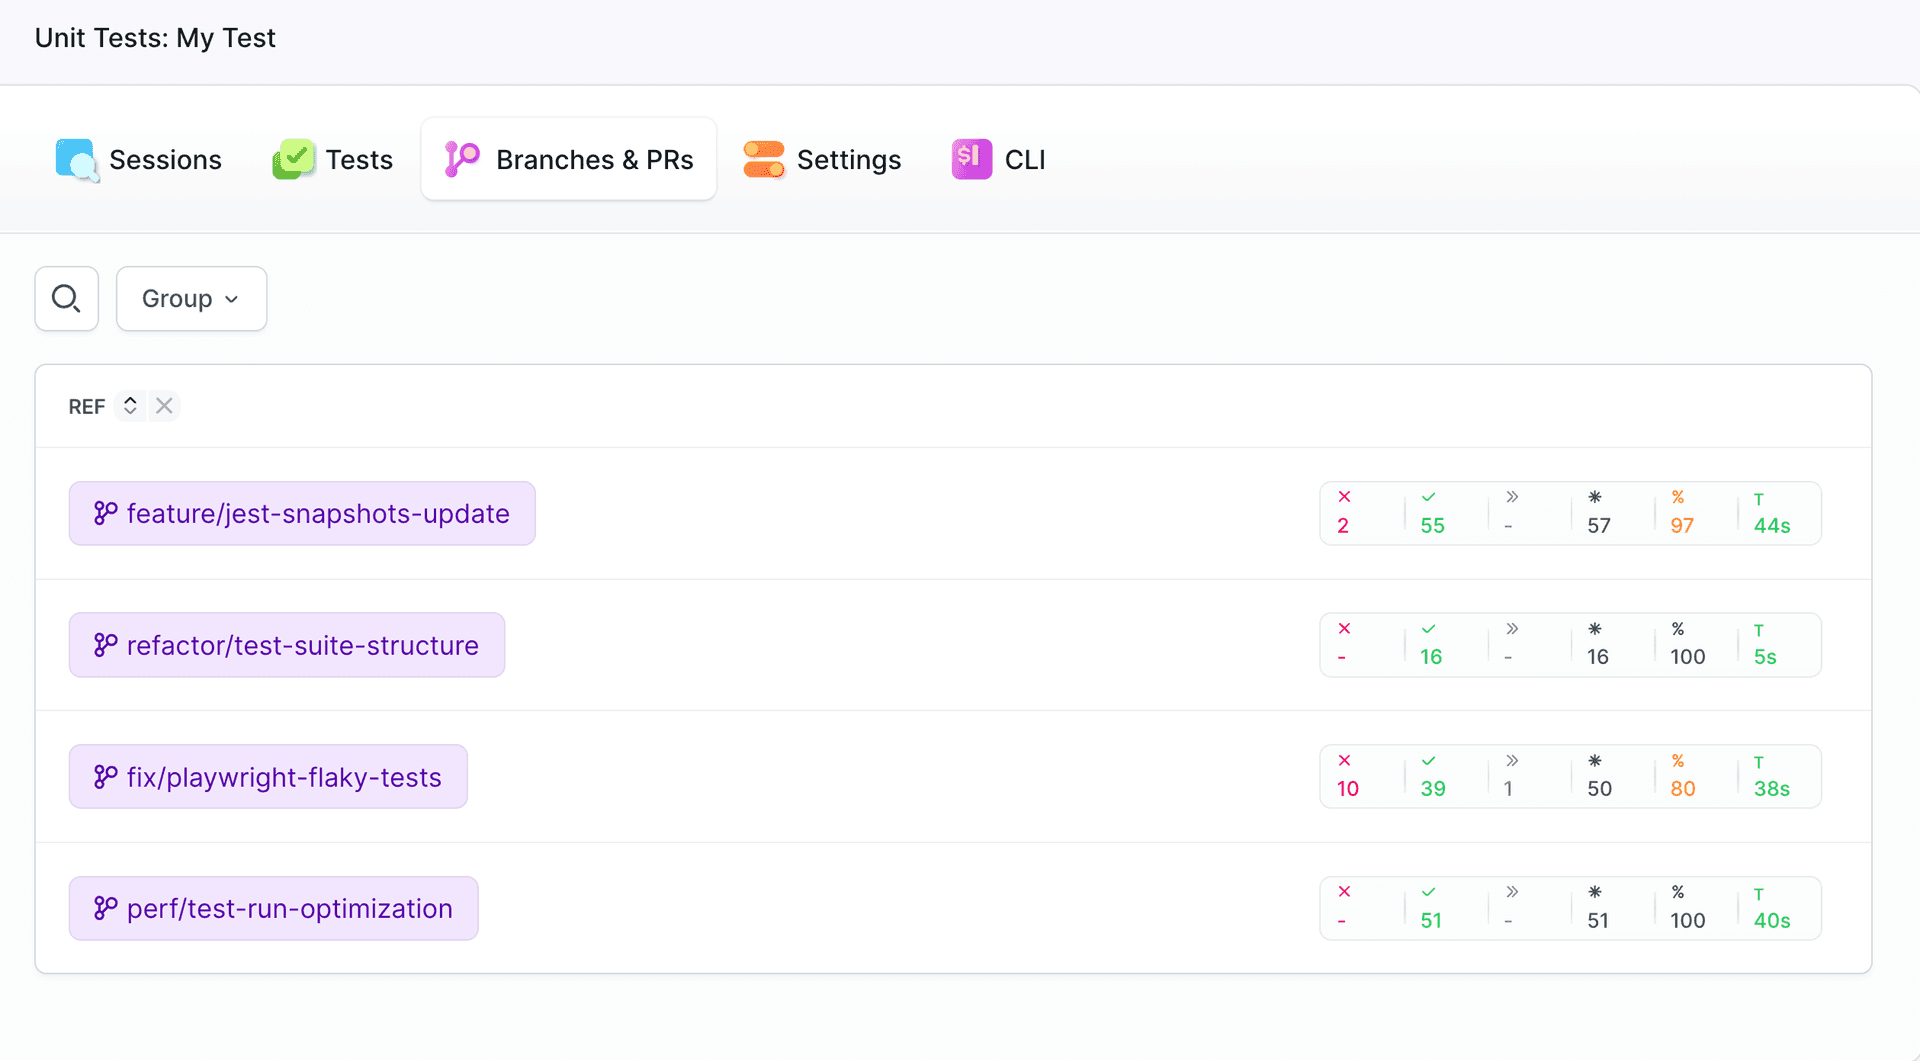
Last modified on Nov 12, 2026