Debug JavaScript in Chrome with DevTools
Image loading...
In this article, you'll learn how to use Chrome DevTools to debug JavaScript code in an efficient manner.
What are Chrome DevTools?
Chrome DevTools is a built-in set of web developer tools in every version of Google Chrome. The JavaScript debugger in Chrome lets you set breakpoints, step through code, and debug JavaScript directly in the browser - no extra extensions needed.
Chrome DevTools panel overview
The DevTools consist of 8 main panels:
- Elements: View the DOM tree and manipulate HTML/CSS and style attributes
- Console: View and debug your JavaScript code
- Performance: Analyze and optimize the speed of web page or application
- Sources: Debug JavaScript code for syntax errors, set breakpoints, call stack, and inspect variables
- Network: Monitor network, view HTTP requests, and simulate different network conditions
- Application: Inspect localStorage, sessionStorage, cookies, IndexDB, and modify storage data
- Memory: Track memory usage, garbage collection, and memory leaks, and fix related issues
- Security: View SSL certificate details and insecure content warnings
- Lighthouse: Audit your app for performance, accessibility, and SEO
Image loading...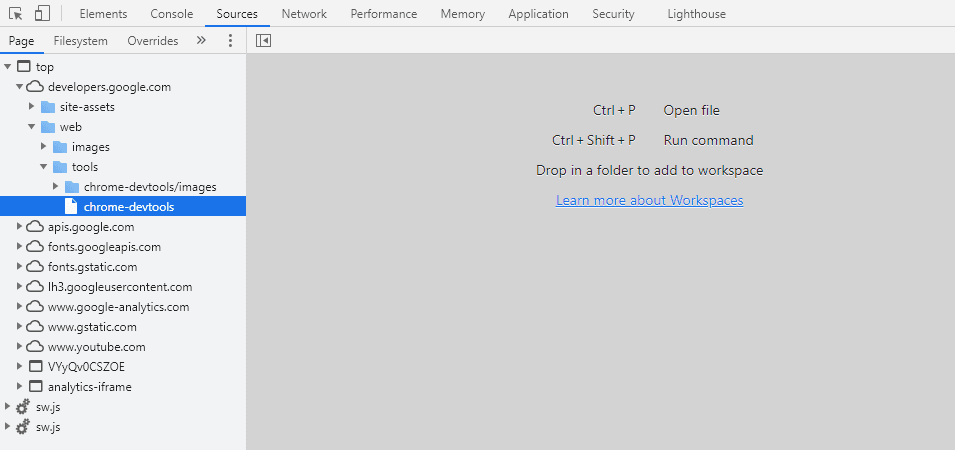
DevTools panel keyboard shortcuts
To open the DevTools Elements panel, press:
- MacOS:
Command + Option + C - Linux/Windows:
CTRL + SHIFT + C
To open the DevTools Console panel, press:
- MacOS:
Command + Option + J - Linux/Windows:
CTRL + SHIFT + J
How to Open and View JavaScript in Chrome (Sources Panel)
Before setting breakpoints, you need to navigate to your script. Here's how to open and view JavaScript source code in Chrome:
- Open DevTools with F12 (Windows/Linux) or Cmd+Opt+I (Mac)
- Click the Sources tab in the top menu bar
- In the left Page panel, expand the domain tree to find your
.jsfiles - Click any file to open it in the center editor panel
- To quickly find a file by name, press Cmd+P / Ctrl+P and type part of the filename
- To search for a specific string across all loaded scripts, press Cmd+Shift+F / Ctrl+Shift+F
How to Debug JavaScript in Chrome with DevTools
The DevTools are basically bread and butter of every developer and don't require much description, so let's get down to some useful strategies that will let you debug your code more efficiently.
How to debug JavaScript in Chrome — quick overview:
- Open Chrome DevTools with F12 (or Cmd+Opt+I on Mac)
- Click the Sources tab to access the JavaScript debugger
- Navigate the file tree on the left to find your script
- Click a line number to set a breakpoint
- Reload the page — execution will pause at your breakpoint
- Inspect variables in the Scope panel and step through code with F10/F11
- Use the Console tab to evaluate expressions at the paused state
1. Add breakpoints
Breakpoints are a powerful debugging feature because they pause code execution, so you can inspect line by line and choose to resume once you're ready. This is especially useful for large source code bases or when it is hard to pinpoint the source of the bug.
Adding a breakpoint
In this example, let's add a line-of-code breakpoint.
Open DevTools and switch to the Sources panel.
In the Page window, select the .js file in which you want to add the breakpoint. The file source code will appear in the middle code editor panel:
Image loading...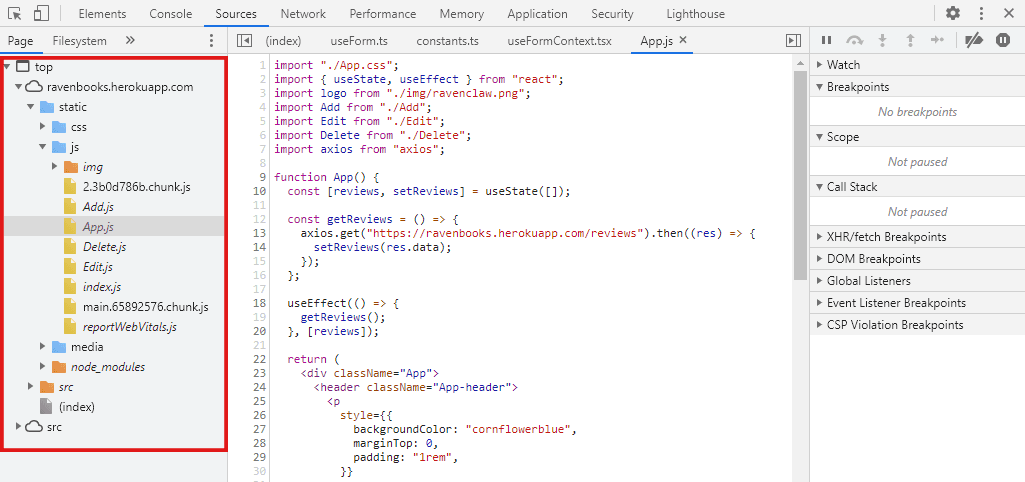
- Right-click the desired line in the gutter and select 'Add Breakpoint':
Image loading...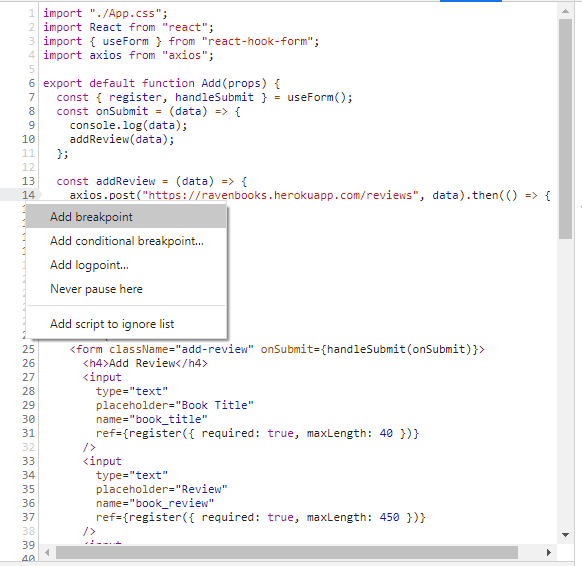
- Run the function now. In my case, it pauses right before executing the POST request, plus I can see the posted
data:
Image loading...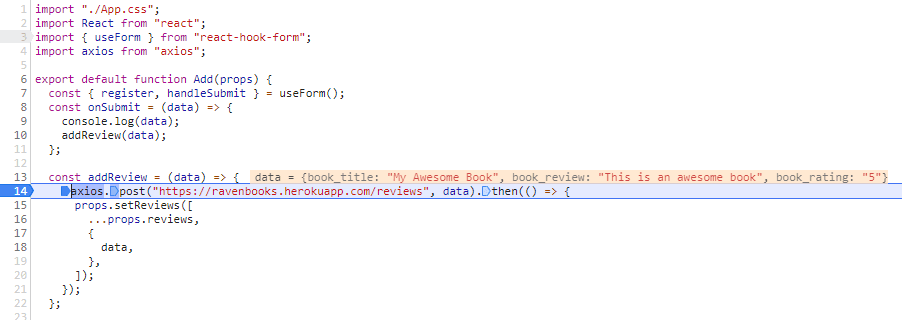
- Once you confirm that everything is in order, click the resume button to continue script execution.
Image loading...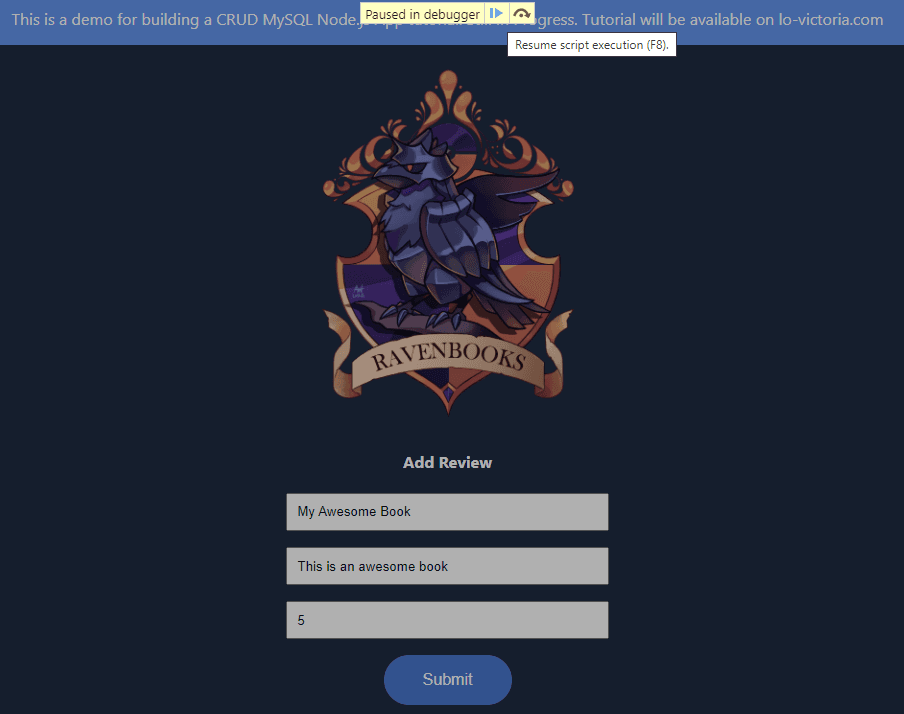
console.log(data) and reloading the page over and over again.

Chrome Debugger: Conditional Breakpoints and Watch Expressions
Standard breakpoints pause on every execution. For loops or event handlers that fire hundreds of times, conditional breakpoints let you pause only when a specific condition is true.
Adding a conditional breakpoint:
- Right-click the line number in the gutter
- Select Add conditional breakpoint
- Type a JavaScript expression, e.g.
count > 10oruser.id === 42 - Press Enter — the breakpoint marker turns orange
The debugger will only pause when the expression evaluates to true, saving you from stepping through irrelevant iterations.
Logpoints work similarly but log a value to the Console instead of pausing — select Add logpoint and type "count is:", count. No console.log in your source code needed.
Watch expressions let you monitor any variable or expression across all pause events:
- In the right Watch panel, click +
- Type any valid JS expression, e.g.
response.data.length - Its value updates automatically each time the debugger pauses
2. View and edit local, closure and global properties
While the app is paused, you can view and edit the local, closure and global properties. Let's assume there's a bug that does not return the correct value for a variable, so you want to check its value at a certain point in the current function.
Once we add the breakpoint, we can expand the 'Scope' panel in the right column of the dev tools and view the variable value. If you want to test the function with other values, you can double-click on the variables to edit.
Image loading...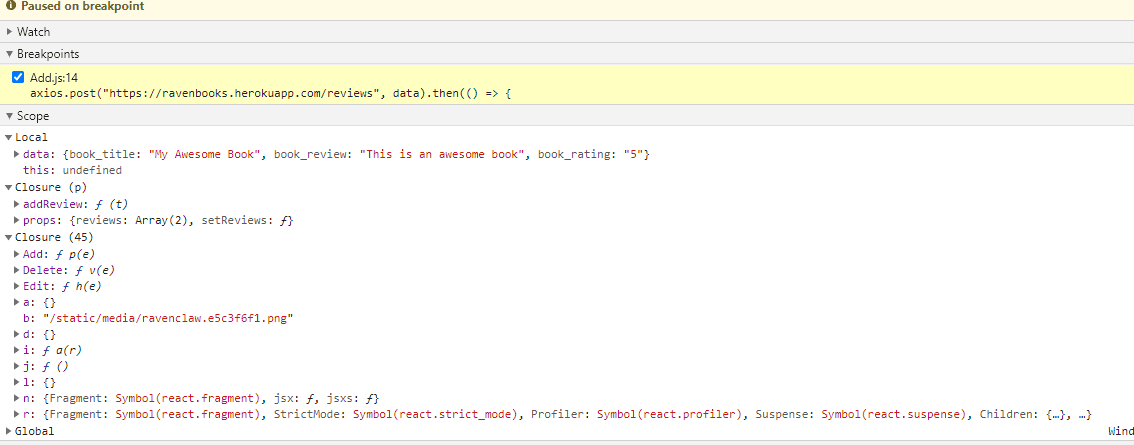
3. Create, save and run snippets
Another efficient strategy is employing snippets. Snippets allow you to easily execute and reuse scripts in any part of your app via the Google's developer tools.
- You can add a snippet by switching to the Snippets tab in the left column.
Image loading...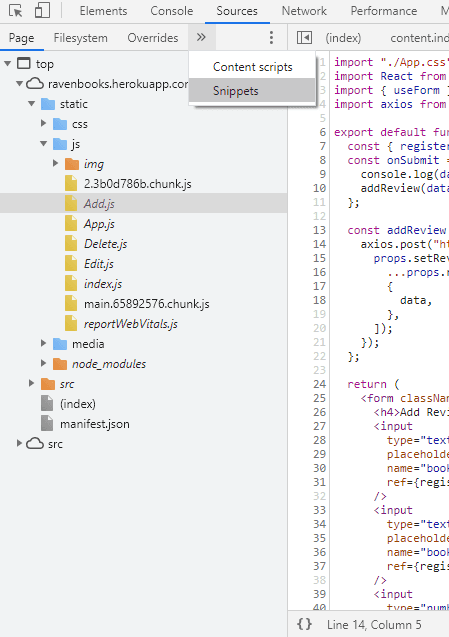
With the tab open, click +New Snippet and write your code in the middle panel as shown in the image below:
Image loading...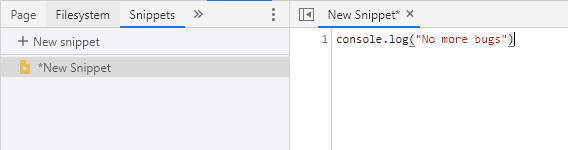
CMD+S / CTRL+S at any time.
The snippet can be executed in two ways:
- Right-click on the snippet and click 'Run'.
- Press
CMD + EnterorCTRL + Enter.
Image loading...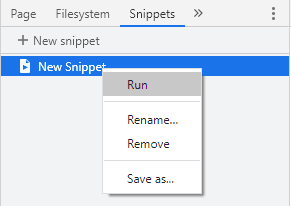
4. View call stack
When debugging the error, you may want to track the changes to the call stack. To display the functions in the stack, switch to the Sources panel and click the Call Stack line to expand it.
Image loading...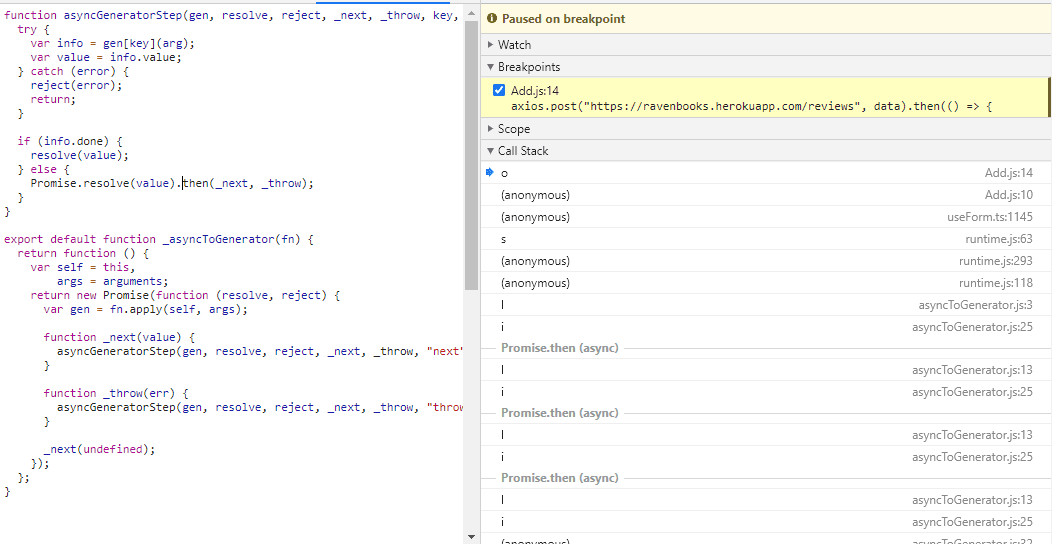
5. Blackbox Scripts in Chrome DevTools
When debugging, you probably want to exclude some scripts from running, such as third-party libraries, or scripts that you know are unrelated to the error.
Instead of commenting them out in your source code line by line, you can blackbox them on DevTools. To do so, click on the script file you want to ignore in the left panel on the Sources tab. Then, right-click on the middle panel and select 'Add script to ignore list':
Image loading...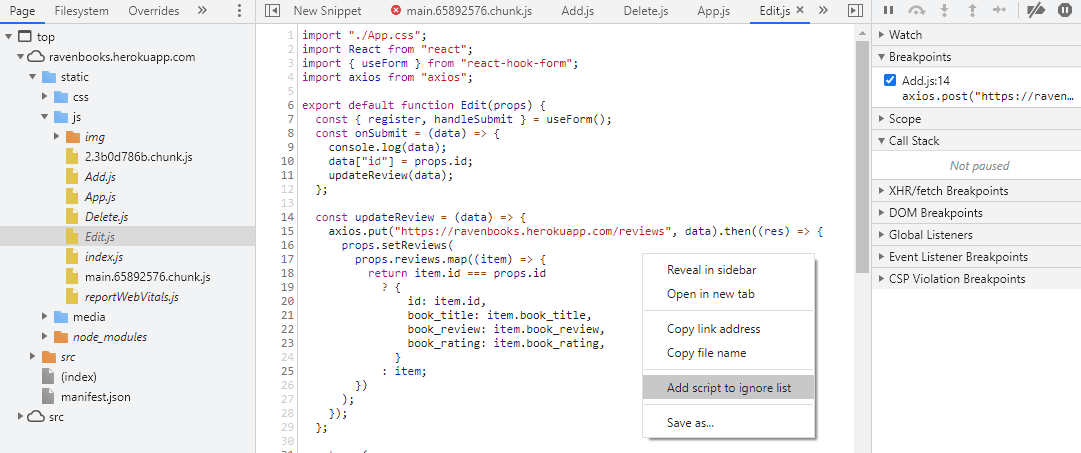
From now on, the script will no longer run, which helps narrow down and eliminate the cause of the error or bug.
From Debugging to Prevention: Write Unit Tests After Fixing a Bug
Finding a bug with DevTools is only half the job. Without a test that reproduces the failure, the same bug can reappear silently in a future commit — especially in a CI/CD pipeline where no one is watching the browser.
The workflow looks like this:
- Reproduce the bug using a breakpoint in Chrome DevTools
- Identify the exact input/state that triggers the wrong behavior (use the Scope panel and Watch expressions)
- Fix the logic in your source code
- Write a unit test that covers this specific case — the test should fail before your fix and pass after
For example, if you found that a function returns undefined when user.role is missing, your test might be:
jsit('returns guest permissions when role is undefined', () => {
  expect(getPermissions({ id: 1 })).toEqual(GUEST_PERMISSIONS);
});
This way, any future regression is caught in CI before it reaches the browser. If you're building with React, Testing React Applications with React Testing Library is a solid next step — it covers component-level tests that complement the debugging workflow above.
To automate these tests on every push, set up a test suite in Buddy and configure a pipeline step to collect results — your test suite runs automatically on each commit, and you get notified before a bug ships.
Conclusion
The possibilities that Chrome DevTools allow for are basically endless. I highly recommend exploring the provided links in the Resources section below to delve further into these features.
Once you become proficient with the toolset, you will enhance your debugging skills and leave behind the days of relying on the console.log() grind.
Thank you for taking your time to read this tutorial. If you found the article helpful, please consider sharing it. Cheers!